
Reading Knowledge Base Usage: Which Articles Earn Their Keep
Tuesday, 14:20, at Meridian Parts. Lena looks after the knowledge base. That is, she is the technician who was in the room when someone asked who looked after the knowledge base. She has opened its usage page for the first time in three months. It says the knowledge base has a hundred and forty articles and had just over three thousand views last month. "Resetting your password" is top with four hundred and twelve. Sixty articles were viewed fewer than five times. An article called "Connecting to the meeting-room screen" was viewed a hundred and eighty times. It has nine "helpful" votes against thirty-one "not helpful". Nobody has looked at those because nobody knew the votes were being collected. Lena has a page full of numbers, a vague sense that some of them are bad, and no idea what to do about any of it.
Knowledge base usage is the set of signals a knowledge base records about how people use it. Those signals are pages viewed, words searched for, searches that found nothing, votes on whether an article helped, and articles opened or linked while a ticket was being worked. Each signal answers one question and is silent on the others. The skill is knowing which question each one answers. That turns the page Lena is looking at into a short list of articles to fix, a shorter list to retire, and a sentence about what the rest are doing. This article is part of our Measuring Self-Service ROI series, and every number in it is a worked example from the same fictional desk.
It covers what the usage numbers can and cannot tell you, then views, and why the loudest signal is the least informative. Next come searches and failed searches, helpful votes and the "this solved it" response, and articles opened from tickets. Then it covers the four kinds of article that the signals sort out between them, with a picture, and which articles to retire and how to tell. Building the monthly report, a short war story and the usage report layout to copy finish the article.
What the Usage Numbers Can and Cannot Tell You
Usage numbers tell you what people did on the knowledge base, and nothing about what happened next. A view is a page opened. A search is a phrase typed. A vote is a button pressed by the small minority who press buttons. None of them is a ticket avoided, a technician hour saved, or a problem solved. The whole mistake of knowledge base reporting is to present them as if they were. The honest use of the numbers is as a sorting device: they tell you which articles to look at, in what order, and which question to ask when you get there. The answers come from the ticket system, by the methods in Measuring What Got Deflected.
The signals come in two groups, and the groups must be read together. The first group measures attention: views and searches say what people wanted and whether they found a page. The second group measures outcome: helpful votes, "this solved it" responses, and a fall in the matching ticket type say whether the page did any good. An article high on attention and low on outcome is busy and failing. An article low on attention and high on outcome is good and hidden. Reading either group alone puts every article in a column and none in a box, and a column is not a decision.
Tools differ in which signals they record, and the method survives the differences. Some knowledge bases count views and nothing else. Some log every search. Some offer a vote, a comment or a "did this answer your question" prompt. Some record when a technician links an article from a ticket reply. Use whatever yours records, and where a signal is missing, borrow the outcome from the ticket system, which every desk has. A knowledge base that counts only views can still be read honestly, as long as nobody mistakes the view count for the result.
Views: The Loudest Signal and the Least Informative
A view count says how often a page was opened, and that is all it says. It does not say who opened it, whether they read past the first line, or whether it answered them. It does not say whether they went on to raise a ticket anyway with "I tried the article" in the first sentence. The four hundred and twelve views of Meridian's password article included an unknown number of people who reset their password successfully. They included some who were locked out and could not act on the article at all. They also included technicians checking the steps before a call, and whoever landed there from the portal's front page by accident. The count is real. Its meaning is not in it.
Views are useful for one thing, which is ranking. The top ten articles by views are the ones most people wanted. So they are the ten to check first for accuracy, for outcome, and for whether the ticket type they address has moved. The bottom fifty by views are the ones to ask hard questions of, though not yet to retire, because low views have two causes and one of them is a bad title. Rank by views, then stop treating views as evidence. A view counter is the knowledge base's way of asking for praise. It should be answered the way you answer a child who wants to know whether their drawing is good: warmly, and without putting it in a report.
The honest view figure, if you must report one, is views per month alongside the ticket count for the same type, over the same months. That way, the reader can see the two lines together. Four hundred views of the password article beside a reset ticket count that fell from about a hundred and ten a month to about forty is a story. Four hundred views on its own is a page statistic. The two lines together also catch the busy-and-failing article at once, because its views are high and its ticket type has not moved at all.
Searches and Failed Searches
The search log is the list of what people typed into the knowledge base's search box. It is the most honest signal on the page because nobody types a search to be polite. A failed search is a search that returned nothing, or returned results nobody clicked. The failed-search list is a list of questions the knowledge base was asked and did not answer. Meridian's top failed search was "wifi", forty-eight times in a month. It returned nothing because the only article on the subject was titled "Wireless network access" and the search did not know the two were the same thing. The second was "printer offline", thirty times, for which there was no article at all.
Read the failed searches every month, in full, including the typos. Each one is one of three things. The first is an article that exists under a title nobody would type. That is fixed by renaming it or adding the words people use. The second is an article that does not exist. That goes on the writing list if the search is common and the ticket type is real. The third is noise, a search for a person's name or a half-finished phrase, which is ignored. How to tune titles and synonyms so the search finds the article is the subject of Search That Answers Before the Ticket. The usage report's job is to produce the list that article acts on, with the counts attached so the biggest gap is fixed first.
Successful searches, where someone typed a phrase and opened a result, are the signal that connects attention to intent. An article that gets most of its views from search was wanted; an article that gets most of its views from the portal's front page was simply there. Where the tool tells you the route, read it. Where it does not, the search log beside the view count usually makes the route obvious. An article whose title words appear forty times in the search log and which was viewed forty-five times was found by people looking for it.
Helpful Votes and the "This Solved It" Response
A helpful vote is a reader pressing a button at the end of an article to say whether it helped. It is the first outcome signal, with two limits that must be stated whenever it is quoted. Few readers vote, so the counts are small and a single article can swing from good to bad on four clicks. And the people who vote are not a fair sample: the frustrated vote more than the satisfied. That is why a run of "not helpful" votes means the article needs looking at, while a run of "helpful" votes means less than it appears to. Nine helpful against thirty-one not helpful, on Meridian's meeting-room screen article, is a signal. Twelve helpful and one not, on the shared-mailbox article, is encouragement.
Read the votes with the comments, where the tool collects them, and read the "not helpful" comments first. They are short, cross and specific: "step 3 button isn't there", "this is for the old system", "doesn't say what to do if it fails". Each one is a free test by a real user of the kind described in Testing Articles on Real Users, delivered without anyone scheduling it. The meeting-room screen article's comments said, eleven times in different words, that the screens in the new building worked differently. The article had been right for a year and wrong for four months, and the votes had been saying so for all four.
The "this solved it" response is the stronger form of the vote. Here, the portal asks the reader directly whether the article answered the question they came with. It records a yes as a ticket that did not need raising. It is the only usage signal that can go straight into a deflection sum as the low estimate, which is how the deflection article in this series uses it. Where the portal offers it, report it per article, per month, beside the ticket type's count. Where it does not, say so in the report rather than substituting the helpful vote, which measures something adjacent.
Articles Opened From Tickets
The fifth signal is the one most knowledge bases hide and most reports ignore: how often technicians use the articles while working tickets. It comes in two forms. The first is the article linked from a ticket reply, which is a technician answering a requester with "the steps are here" and a link. It is a count the ticket system can produce by searching replies for the knowledge base's address. The second is the internal runbook opened during a ticket, which some tools record and most do not. Otherwise, this signal comes from asking the technicians to note "used KE-12" or "runbook" in the ticket when they do. Both forms say the article is doing work that no view count attributes to it.
Articles opened from tickets are the bridge between this article and the next in the series. A public article linked from fifty replies a month is shortening fifty tickets, because the technician wrote one line instead of eleven steps. It is also teaching fifty requesters where the answer lives next time. An internal runbook opened thirty times a month is the thing that turned a forty-minute mapped-drive ticket into a six-minute one. Neither shows up as deflection, and both are hours, measured by the method in The Time Saved by Technicians. The usage report's job is to count the openings, so that the hours can be worked out from them.
Separate the two audiences in the report. A knowledge base that holds both public articles and internal runbooks has two readerships with different signals: requesters view, search and vote; technicians open and link. Where the knowledge base marks each article as visible to everyone or to the desk alone, as QuerySolv does, the two readerships are already split. The report can then show them in two sections. Where it does not, keep a list of which articles are internal and split the counts by hand. A runbook with twelve views a month is doing its job and a public article with twelve views a month is probably not.
Four Kinds of Article
Put attention on one axis and outcome on the other and every article in the knowledge base falls into one of four boxes. Each box has a different action. The picture below draws them. Across the bottom is views per month, few on the left and many on the right. Up the side is outcome, poor at the bottom and good at the top. Here, outcome means helpful votes and "this solved it" responses where they exist, and whether the matching ticket type has fallen. Views decide the column. Outcome decides the row. An article is never placed by views alone, which is the single rule that stops the most views being mistaken for the most value.
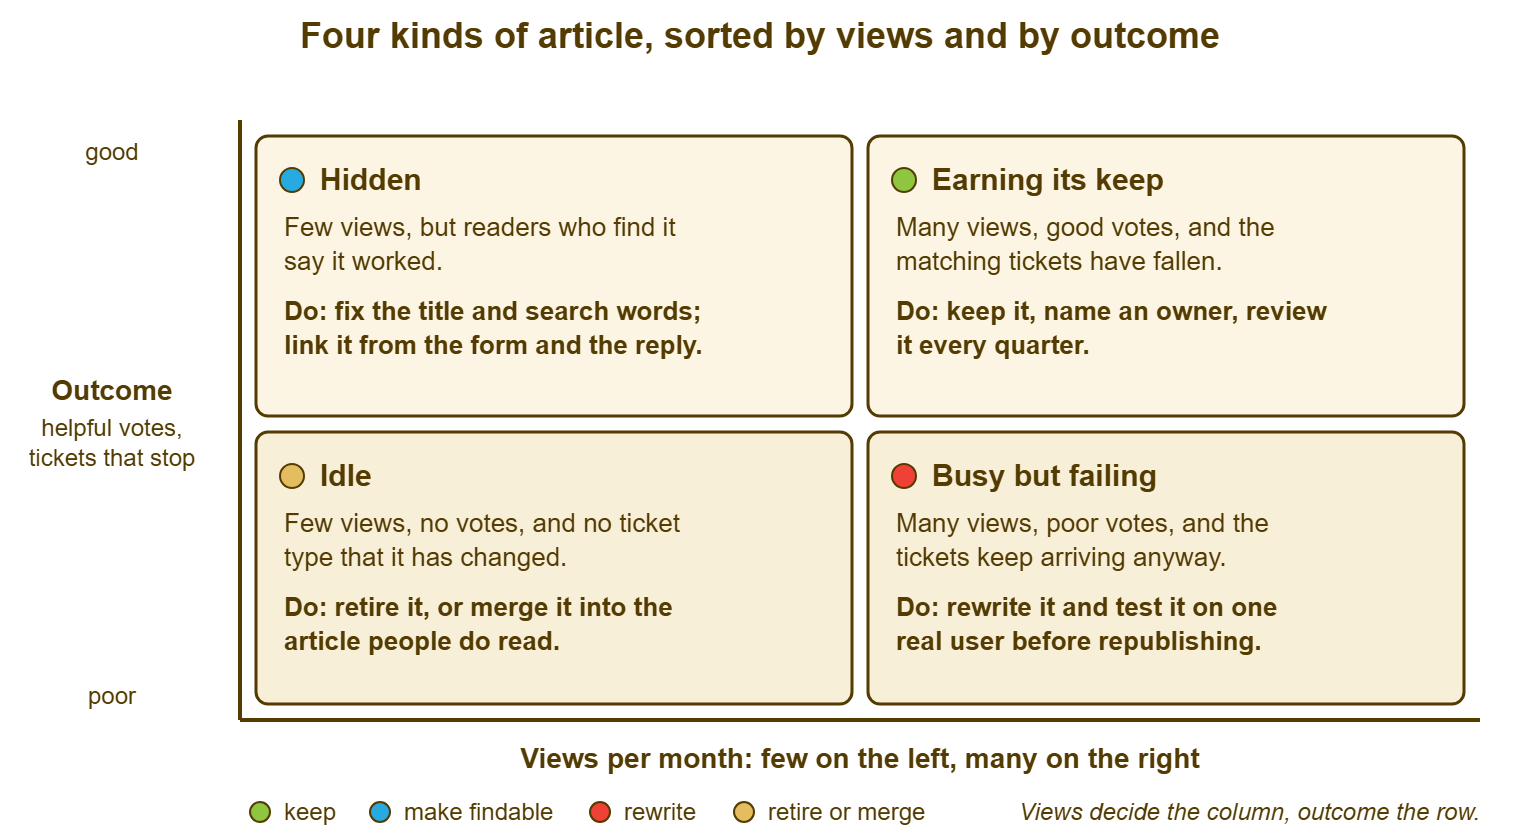
Top right is earning its keep: many views, good votes, and the ticket type has fallen. Meridian's password and VPN articles lived here. The action is to protect them: a named owner, a quarterly check that the steps still match the screens, and nothing else. The commonest way to break a good article is to improve it. Top left is hidden: few views but the people who find it say it worked, and the ticket type may have dipped. The shared-mailbox article, fourteen views and twelve helpful votes, was here. The action is on the title and the search words, and on linking it from the places the question gets asked, such as the request form and the acknowledgment.
Bottom right is busy but failing: many views, poor votes, and the ticket type has not moved or has risen. The meeting-room screen article was the example, and the action is a rewrite tested on one real user before it goes back up. This box is the most expensive one to leave alone. Every view in it is a person who tried self-service, was let down by it, and raised a ticket anyway with slightly less patience than they started with. Bottom left is idle: few views, no votes, no ticket type it has changed. Sixty of Meridian's articles were here, and the action is the subject of the next section. Idle is not the same as worthless and the difference takes a minute to check.
Remember: views rank articles; they never value them. Place every article by two signals, attention and outcome, and act on the box it lands in: protect, make findable, rewrite, or retire.
Which Articles to Retire, and How to Tell
An article is a candidate for retirement when it has sat in the idle box for two quarters running. That means few views, no outcome signal, and no ticket type whose count it could plausibly have changed. Two quarters, not one, because a seasonal article, the one about the year-end stock-take or the summer intern accounts, is idle for nine months and essential for three. Retiring it in its quiet season is how the desk ends up rewriting it from memory. Check the title before deciding, because an idle article with a title nobody would type is a hidden article wearing the wrong label, and renaming costs a minute.
Then ask three questions of each candidate, in order. Is it an internal runbook? Runbooks are read rarely and matter when they are read, and they are judged by the technician-time method, not by views. An idle runbook for a system the desk still supports stays. Is there another article that does the same job better? Then merge the useful lines into that one and redirect or remove this one, so that the search returns one answer rather than two. Is the thing it describes still in use? If the system was retired, so is the article. Sixty articles with fewer than five views a month are not a library. They are a shelf in a garage, and the garage is where people go to find things and fail.
Retire means remove from view, not destroy. Keep the text somewhere the desk can find it, with the date and the reason, because the question the article answered occasionally comes back. The old answer is a head start. Most knowledge bases have a way to unpublish or archive an article; where yours does not, move it to an internal section marked as retired. What matters for the ROI figure is that the article leaves the public count. That way, the knowledge base the desk reports on is the knowledge base that is actually working. Structural upkeep beyond this, ownership, review dates, and the periodic check of the whole library, belong to A Knowledge Base Health Check; the usage report is the monthly feed into it.
| Signal | What it counts | What it tells you | What it does not tell you |
|---|---|---|---|
| Views | Page openings per article per month | Which articles to check first; whether anyone finds the page | Who opened it, whether they read it, whether it helped |
| Searches | Phrases typed into the search box | The words people actually use; what they wanted | Whether the result answered them |
| Failed searches | Searches with no result, or no click | Questions the knowledge base did not answer; titles that need the users' words | Whether the question deserves an article (check the ticket type) |
| Helpful votes and comments | Button presses and short comments at the end of an article | Articles that are wrong or out of date, from the "not helpful" comments | How many readers were helped; voters are few and mostly frustrated |
| "This solved it" responses | Readers confirming the article answered their question | A floor for avoided tickets, per article per month | The ceiling; readers who were helped and did not say so |
| Opened or linked from tickets | Articles linked in replies; runbooks opened while working a ticket | Articles doing technician-time work that views never show | The minutes saved; that comes from the before-and-after sample |
Building the Monthly Report
The report is one page, produced once a month, from the knowledge base's usage page and the ticket system's counts. It should take under an hour once the layout exists. It opens with six headline numbers, each shown against last month and as a three-month trend. These are total views, distinct searches, failed searches, the vote rate, articles linked from replies, and internal articles opened during tickets. Then the top ten by views, each with its votes, its ticket type, and that type's count this month against the baseline. That way, the box each article belongs in can be read off the row. Then the top ten failed searches, each with the article that should have matched or the note "none: write it". Then the lists for action: hidden, busy but failing, and retirement candidates. Then the actions agreed, with an owner and a date.
The ticket counts are the part most reports leave out and the part that turns the report from statistics into evidence. For each top-ten article, the row needs the ticket type it answers and the number of tickets of that type this month beside the baseline from before the article existed. That column is what tells you whether the article is earning its keep or merely being read, and it comes from the ticket system, not the knowledge base. Most ticketing tools will give the count by type for a month from a filter. Where the type field is unreliable, the tally from ticket content described in the deflection article is the fallback. Build the column once, and updating it monthly is a few minutes.
Resist adding to the page. A knowledge base usage report that grows a new section every month becomes a document people are sent and nobody opens. The sign is that the actions list at the bottom stops changing. The test of the report is that every month it names at least one article to fix and one to make findable. Every second quarter, it also names one or two to retire. Each action has a name against it. If a month produces no actions, either the knowledge base is perfect or the report is being skimmed, and I have met only one of those. The layout at the end of this article is deliberately short so that the actions are the part that gets read.
A Short War Story: The Nine-Hundred-View Article at Harbourview Clinic
At Harbourview Clinic, the most-viewed article in the knowledge base was "Logging in to the clinical system from the ward laptops", at around nine hundred views a month. A technician called Dominic cited it in every quarterly summary as the knowledge base's biggest success. That was because it was the number at the top of the usage page. Nobody read the votes, which ran at roughly eight "not helpful" to every "helpful", or the comments, which said in thirty different ways that the login screen in the article was the old one. The clinical system had changed its sign-in flow after a supplier update; the article had not. For five months the ward staff did what the article said, failed, and raised a ticket, about sixty a month. Most of them began "I followed the knowledge base article and". The desk spent, by its own later count, around thirty technician hours a month on tickets the article had caused, while reporting the article as a saving. The rewrite took Dominic ninety minutes. The ticket type fell to single figures the following month, and the votes turned around in a fortnight. An article with the most views and the worst votes is not the knowledge base's biggest success; it is its biggest ticket generator. The usage page had been saying so the whole time.
The Usage Report Layout
The layout below is the one page, with the six headline signals, the top ten by views with their ticket counts, the failed searches, the three action lists and the agreed actions. Fill it from the knowledge base's usage page and one filter on the ticket system. Where your knowledge base lacks a signal, write "not recorded" in that line rather than leaving it blank. That way, the gap is visible and nobody later assumes the number was zero. The box column in section two is filled in last, from the row, and it is the column that drives sections four to six. Keep the completed reports; a year of them is the knowledge base's history and the raw material for the one-page case to management.
KNOWLEDGE BASE USAGE REPORT — ONE PAGE, MONTHLY
Month: ____________   Articles published: ____ (public ____ / internal ____)
Prepared by: ______________   Date: ____________

1. HEADLINE SIGNALS                     this month   last month   3-month trend
   Total views ......................... ____         ____         rising / flat / falling
   Distinct searches ................... ____         ____         ____
   Failed searches (no result/no click)  ____         ____         ____
   Helpful votes: yes ____  no ____  ..  rate ____    rate ____    ____
   Articles linked from ticket replies . ____         ____         ____
   Internal articles opened in tickets . ____         ____         ____
   (write "not recorded" where the tool does not keep the signal)

2. TOP TEN BY VIEWS
   #  Article title              Views  Votes yes/no  Solved-it  Ticket type   Tickets now vs baseline  Box
   1  _________________________  ____   ____ / ____   ____       ___________   ____ vs ____             ______
   2  _________________________  ____   ____ / ____   ____       ___________   ____ vs ____             ______
   3  _________________________  ____   ____ / ____   ____       ___________   ____ vs ____             ______
   (continue to 10; Box = earning / hidden / failing / idle)

3. FAILED SEARCHES, TOP TEN
   Words typed                 Times   Article that should have matched, or "none: write it"
   __________________________  ____    ______________________________________________
   __________________________  ____    ______________________________________________
   (continue to 10)

4. HIDDEN (good outcome, few views): rename, add search words, link from the form
   __________________________   __________________________   __________________________

5. BUSY BUT FAILING (many views, poor outcome): rewrite and test on one real user
   __________________________   __________________________

6. RETIRE OR MERGE CANDIDATES (idle for two quarters; title checked; not a live runbook)
   __________________________   __________________________   __________________________

7. ACTIONS AGREED                                   Owner           By
   ____________________________________________     ____________    ________
   ____________________________________________     ____________    ________
   ____________________________________________     ____________    ________
Lena produced the first report in a little under two hours, most of it spent building the ticket-count column. It named three things. Rename "Wireless network access" so that "wifi" finds it. Rewrite the meeting-room screen article and test it on someone in the new building. Review twenty-two idle articles with the desk at the next team meeting. The second month's report took forty minutes and named four things. By the third, the sixty idle articles were thirty-eight and the meeting-room tickets had halved. The usage page had stopped being a page full of numbers and become a list of jobs, which is the only thing a usage page is for.
Frequently Asked Questions
Our knowledge base only counts views. Can we still read usage honestly?
How many votes does an article need before the vote rate means anything?
Should technicians' own views be excluded from the counts?
How long should an article be idle before we retire it?
What is the most important line on the usage report?
Who should receive the monthly usage report?
From the QuerySolv team: we build self-hosted help desk software for Windows. QuerySolv runs as one Windows service on your own network. It takes requests by web form, e-mail, live chat, social messages and REST API. It is licensed once per installation rather than per agent per month. The free trial runs the full product for 30 days.