
Measuring Ticket Quality and Fixing the Form, Not the User
Friday, 11:30, at Westmere Legal. A partner has asked Omar, who runs the three-person desk, why IT "takes so long". Omar has the monthly report open to answer her. It looks fine. Average resolution time is under a day. The backlog is small. Satisfaction is high among the people who answered. He cannot see what she means. So he does something the report does not do. He opens ten tickets from the last fortnight at random, reading them from the top. On seven of the ten, the first thing the desk wrote was a question. On five, the requester's answer arrived the next day. On three, there was a second question. The fixes, when they finally began, took under an hour each. The desk was not slow. The tickets had been arriving un-workable. The clock that the report measured had been running while two people traded e-mails about which printer.
Omar had been measuring how long tickets took and not how they arrived. The two are different numbers that look like one. A ticket that needs two exchanges before anyone can start has lost a day or two before the technical work even begins. That loss is invisible in every number the desk usually watches. The ticket is "being worked" the whole time. The loss is only visible if you count the exchanges. Nobody at Westmere had counted. Nobody at most desks has.
Ticket quality is whether a ticket arrives carrying enough for work to start without the desk asking anything. It is a property of the system that produced the ticket: the form, the channel, the acknowledgment and the examples. It is far more a property of that system than of the person who wrote it. This article is part of our Getting Better Tickets From Users series and is its last. The earlier articles say what to change. This one says how to tell whether the change worked. It also says how to read the numbers so that what gets fixed is the form rather than the user.
It covers what ticket quality means and why it belongs to the system. Next come the exchanges-before-work count, the first-reply-is-a-question rate, quality by channel and quality by department. Then it covers reading the numbers as a report on the form, with a diagnosis table, and sampling by hand without a report. It finishes with what not to do with the numbers, a short war story and the ticket-quality scorecard to copy.
Quality Belongs to the System, Not the Person
A ticket is good if a technician can start work from it without asking anything. Whether that happens is decided mostly before the requester types a word. The form either asked for the device or it did not. The acknowledgment either asked for a photo or it did not. The requester either saw an example of a good ticket or an empty box. The same person, raising the same fault, produces a workable ticket through a good form and "it's broken" through an e-mail address. The difference is not their effort. It is which door they came through and what the door asked.
That is why the measurement is pointed at the form and not at the requesters, and why this article keeps saying so. A number that says "a third of tickets need a question before work starts" is a statement about the desk's intake design. A number that says "the finance team writes bad tickets" is the same data read as a verdict on people. It leads to memos, league tables and a department that stops raising tickets. All of those are things Training Users to Write Better Tickets Without Lecturing spends its length warning against. Read every number in this article with the question "what would we change about the form, the channel or the acknowledgment?" Never read it with "who do we need to talk to?"
The honest exception is that people do vary. A desk will always have a few requesters whose tickets are one line however good the form is. They are a cost of a few minutes per ticket, met with a phone call, and they are not what the numbers are for. The numbers are for the pattern across hundreds of tickets, where individual habits wash out and what remains is the shape of the intake. If the shape is bad, it is bad for everyone. In that case, it is fixed once, for everyone, in the form.
The Exchanges-Before-Work Count
The exchanges-before-work count counts the times the desk had to ask and the requester had to answer. It counts only those exchanges before the first piece of actual work was done on the fault. It is the most honest single measure of ticket quality a desk can keep. A ticket that arrives with the five facts and a photo scores zero. A ticket that needs one reply from the desk and one answer scores one. The Westmere tickets with a question, an answer, a second question and a second answer score two. The two exchanges cost two days. Requesters answer e-mail when they get to it, which is tomorrow.
Count it by reading the ticket's history from the top and stopping at the first entry that is work rather than a question. Work means a remote connection, a visit, a change made, a reply saying "I have found the cause", a reassignment to someone who will fix it. A question is anything that asks the requester for a fact. Count the question-and-answer pairs before the first work entry. That is the score. Record alongside it the time from the ticket opening to that first work entry. That is the time to workable. The exchange count says how many times you asked and the time says what it cost. Two exchanges at Westmere cost a day and a half. Two exchanges on a desk whose requesters reply within the hour cost two hours. Same count, very different bill.
The picture below shows the count on one fault twice. Ticket A arrived as "printer broken" on Monday morning. The desk asked which printer and got an answer on Tuesday. It asked what the screen said and got a photo on Wednesday. Work started on Wednesday at nine, two exchanges and two days after the ticket opened. Ticket B is the same fault raised through a form that asked the five questions, with a photo attached. Work started eighteen minutes after it opened, with no exchanges at all. The technical work on both was identical and took about forty minutes. Everything else about Ticket A was the intake.
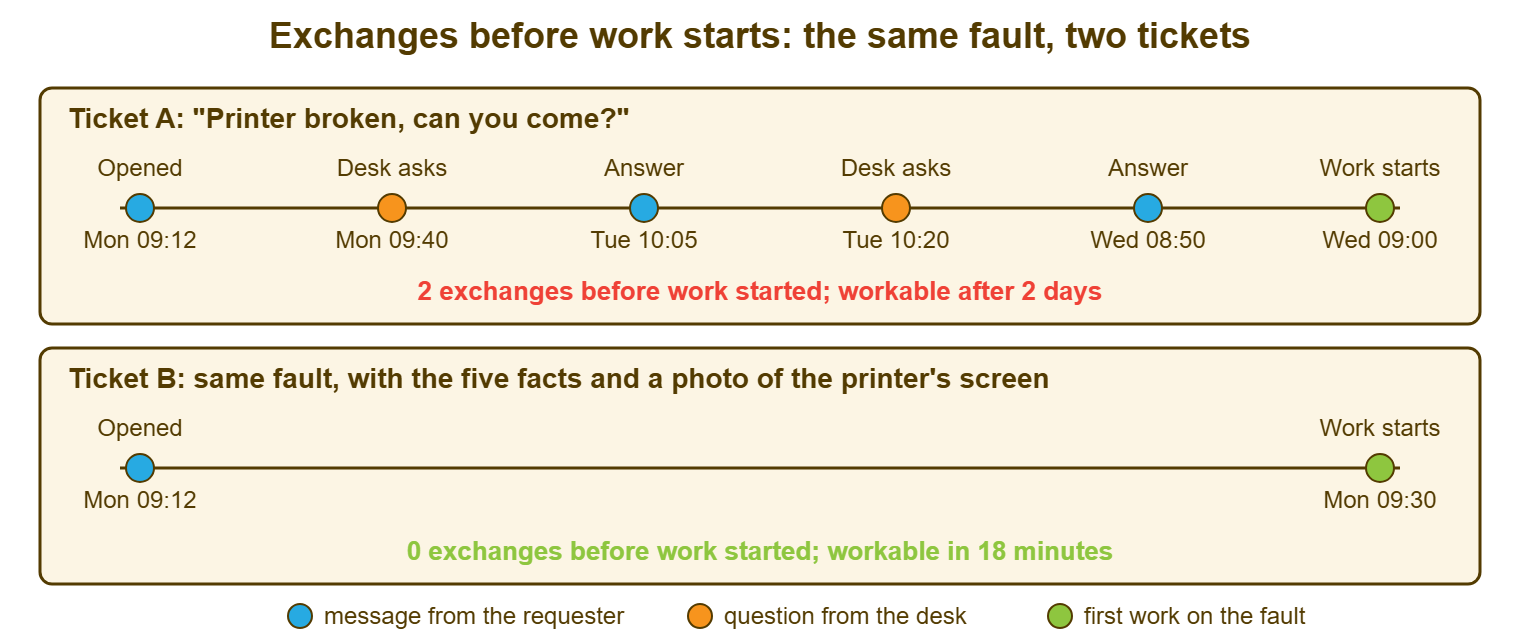
Report the count as a distribution, not an average. "Median zero, a quarter of tickets at one, one in ten at two or more" tells you where the problem is and roughly how big. "Average 0.6" tells you nothing you can act on. The tickets scoring two or more are the ones to read. Each of them is a small story about a fact the intake failed to collect. Ten of those stories, read in a row, will name the field that needs fixing more reliably than any chart. The event history on every ticket is where the count comes from. QuerySolv keeps that complete history on each ticket and exposes it through its REST API. So a desk that wants to count by script rather than by hand can. But by hand is where to start.
The First-Reply-Is-a-Question Rate
The first-reply-is-a-question rate is the share of tickets on which the desk's first message to the requester asked for a fact rather than reporting progress. It is the quick version of the exchange count for desks that have ten minutes rather than forty. Open each ticket in the sample and read the first thing the desk wrote. Mark it Q if it asked for anything about the fault and W if it did not. "Which printer is it?" is a Q. "I think the mortgage system is timing out; I am checking the server now" is a W. "Thanks, I have your ticket and will look at it by three" on its own is neither and is skipped. It is an acknowledgment rather than a reply. Read the next desk entry instead.
The rate moves fast when the intake changes, which is what makes it useful. Rewrite the where-field label on Monday and the rate on form tickets drops the following week. The fact that was being asked for is now arriving. Add two lines to the acknowledgment and the rate on e-mail tickets drops within a fortnight. It is the number to watch while making changes, and the exchange count is the number to report quarterly. The exchange count carries the cost and the rate carries the signal. Omar's seven out of ten was the rate. It told him in ten minutes what the monthly report had hidden for a year.
Do not set a target for the rate, and do not tell technicians it is being watched. The reason becomes obvious the moment you imagine being a technician who knows. A technician whose question rate is measured stops asking questions and starts guessing. The guesses show up a fortnight later as reopened tickets and wrong fixes. The rate is a measure of the intake, read by the person who owns the form. The technicians should ask every question a ticket needs without a thought for the number. If the rate is high, the form is at fault, and the technicians asking questions are doing exactly what a bad form requires of them.
Remember: count the exchanges before work starts and the share of first replies that are questions. Do this by channel and by department, on a sample read by hand each month. Read every number as a report on the form, the channel and the acknowledgment. Never set a target on the question rate, never publish it by person or department, and watch the reopen rate alongside it.
Quality by Channel
Split both numbers by the door the ticket came through. The split will usually show the form producing far fewer questions than e-mail. That is the pattern you expect and the one that tells you the form is working. A form that asks for the five facts should produce tickets scoring zero most of the time. E-mail should score worse, since it asks for nothing. Chat tends to score worse still at the point of ticket creation, because chat is one sentence at a time. The exception is when the agent asks the question set during the conversation before the ticket is made. Phone and walk-up should score zero, because the technician was there to ask. If they do not, the technician is not writing down what they were told. That is a notes problem rather than an intake one.
The surprises are where the work is. Form tickets that still need a question mean a field is not doing its job. The label is unclear, the example is missing, or the fact being asked for is not on the form at all. Read the questions being asked on form tickets and they will name the field. E-mail tickets scoring two or more on most tickets mean the acknowledgment is not asking for anything, or asks in words requesters do not act on. A channel whose share of tickets is rising while its quality is falling is a channel people are being pushed to. Usually, a form that got harder is pushing them there. That is the signal Required Fields Without the Revolt says to watch after any field is made mandatory.
The channel split also sets the priority of fixes. Suppose e-mail is a third of tickets and scores two, while the form is half of tickets and scores zero. Then the biggest gain is moving people from e-mail to the form, not improving the form. If the form is most of the volume and scores one, the biggest gain is the form field being asked about. The split tells you where the days are being lost, and the days are what the partner at Westmere meant by "takes so long". How intake differs by channel from the triager's side is in Triage by Channel. The quality numbers are the same picture from the far end.
Quality by Department
Split the numbers by the requester's department as well. Read the result as a map of which parts of the building the form was not designed for. A department whose tickets need a question on every channel usually has one of three things. Those are its own vocabulary, its own devices, or its own kind of request that the general form does not ask about. Reception has card readers and a queue. The warehouse has handheld scanners nobody can find the label on. Finance has a month-end deadline that the how-bad field never mentions. Their tickets arrive vague because the form was built for the desk's idea of a typical requester. They are not typical.
The fix for a department that scores badly is on the desk's side. It could be an example beside the where-field in their words or labels on their devices where the stickers are missing. It could be a line in their acknowledgment about the deadline, or their own short form if their requests are different enough. What it is never is a conversation with their manager about ticket quality. That conversation turns a form defect into a performance issue. The department stops raising tickets, and the desk's numbers improve for the worst possible reason. The department split exists to tell the desk which examples to write, and it should never leave the desk.
Watch for the department that scores well and raises few tickets. A quiet department with perfect tickets is sometimes a department that has learned what the form wants. Sometimes it is a department that has stopped using the desk except for the easy cases. In that case, everything else is going to a colleague or a shadow channel. Compare their ticket count to their headcount. If it is low, the good score is a sample of the people who still bother. The quiet failures that hide behind good numbers are the subject of The Seven Ways Support Quietly Fails. Ticket quality can be theatre as easily as any other metric.
Reading the Numbers as a Report on the Form
Each pattern in the numbers points at one part of the intake, and the table below is the dictionary from symptom to fix. The left column is what the sample shows. The middle is what it says about the system. The right is the change to make. That change is always to the form, the acknowledgment, the examples, the labels on devices, or the channel mix, and never to the requesters. Use it monthly. Pick the one row that costs the most days and make that change. Read the sample again the following month to see whether the row moved.
| What the sample shows | What it says about the intake | The fix, on the desk's side |
|---|---|---|
| Form tickets still need "which device?" | The where-field label or example is unclear, or the list does not include their place | Rewrite the label as a question, say where the sticker usually is, add their place to the list |
| The most common question is "what does the screen say?" | No photo prompt, or one that assumes requesters know what a screenshot is | Add "take a photo with your phone" to the form and the acknowledgment, with the one-line reason |
| The most common question is "is anyone else affected?" or "is there a deadline?" | The how-bad questions are not on the form | Add the two how-bad questions as asked fields with examples |
| E-mail tickets score two or more; form tickets score zero | The form works; the e-mail route asks nothing and too many people use it | Two training lines in the e-mail acknowledgment; the one-line invitation to the form; make the form easier to find |
| Form share falling, e-mail share rising, overall score worsening | The form got harder, usually a new required field | Set the field back to asked; retest the form with three real users |
| One department scores badly on every channel | Their vocabulary, devices or requests differ from the form's assumptions | Examples in their words, labels on their devices, a department-specific form if needed |
| The most common question is "who is this for?" | Tickets arrive from shared mailboxes or forwarders | Correct the requester at first touch; ask shared-mailbox teams to put the person's name in the first line |
| Chat tickets score badly at creation | The chat agent is creating the ticket from the opening sentence | A short question set the agent asks in the chat before creating the ticket |
| Phone and walk-up tickets score badly | Technicians are not writing down what they were told | A notes standard for walk-ups and calls; the five facts recorded at the time |
| Question rate falling while reopen rate rises | Technicians have started guessing instead of asking, usually because the rate is being watched | Stop watching the rate by person; say so; fix the form instead |
Most desks that run the table for the first time find that the top two rows account for most of the lost days. Nobody asked which device, and nobody asked for a picture of the screen. Both are fixed in an afternoon by rewriting one label and adding one line to the acknowledgment. Both show up in the following month's sample as a drop in the question rate that nobody had to be trained to produce. The form did the training. The numbers only told you which sentence to write.
Sampling by Hand, Without a Report
None of this needs a report the tool does not have. Thirty tickets a month, read by hand in a spreadsheet, is enough and takes about forty minutes. Pick the thirty at random from the month's closed tickets, not the ten you remember. Give each one a row with eight columns. Start with the ticket number, the channel it arrived by and the requester's department. Next come whether the first desk reply was a question and the number of exchanges before work started. Then record the hours or days from opening to that first work entry. Finish with the most common fact that was asked for and whether the ticket was later reopened. The last column is the counterweight, and the reason for it is in the next section.
The arithmetic is two formulas. With the question column holding Q or W in rows two to thirty-one, the rate is =COUNTIF(D2:D31,"Q")/COUNTA(D2:D31). The typical exchange count is =MEDIAN(E2:E31). Sort by channel and run them again per channel. Sort by department and do the same. Thirty tickets is small enough that one department's three tickets prove nothing. It is large enough that a channel scoring badly across its ten is a real pattern. Trends over three months matter more than any single month.
Write down the fix you made each month on the scorecard, so that next month's numbers can be read against it. "Rewrote the where-field label on the 4th" beside a form question rate that fell from a third to a tenth is evidence that the label was the problem. The same fall with no change recorded is a quiet month and will come back. The scorecard is a lab notebook for the form, one entry a month. After a year it is the history of how the desk's intake got good. That is a document worth having when someone asks why the form looks the way it does.
What Not to Do With the Numbers
Never publish the question rate by technician, by requester or by department, and never set a target for it. Every one of those uses turns a measurement of the form into a measurement of people. People respond to being measured. A technician whose question rate is on a dashboard stops asking and starts guessing. A department whose vague-ticket count is reported to its head stops raising tickets. A requester told their tickets score badly phones a friend in IT instead. In each case the number improves and the desk gets worse, which is the signature of a metric pointed at the wrong thing.
Watch the reopen rate alongside the question rate, every month, as the counterweight. A fall in questions that is bought with guesses shows up there within a fortnight. A desk that asks fewer questions and reopens no more tickets has fixed its intake. A desk that asks fewer questions and reopens more has stopped translating and started assuming. The second number is the one that tells you which. Reopens, and how to count them without flattering yourself, are in Measuring Reopens Honestly. Keep the two numbers on the same page, and read them together or not at all.
Do not let the numbers become the point. The scorecard exists so that one person, once a month, can decide which sentence on the form to rewrite. If it grows into a quarterly deck with trend lines and a target for next year, it has stopped doing that job. A form optimised for a score acquires required fields. Forty minutes, thirty tickets, one fix, written down. Then the form again next month. That is the whole discipline, and it is dull, which is how you can tell it is working.
A Short War Story: The League Table at Greyfield Council
At Greyfield Council, the desk lead, Fiona, built exactly the scorecard in this article. Pleased with it, she added a column that ranked the council's nine directorates by their share of tickets needing a question. Then she sent the table to the directorate heads with a note suggesting they "encourage better tickets". Housing came bottom, with two in three of its tickets scoring a question, mostly "which office?". Housing had eleven neighbourhood offices and the form's location list had three. Within six weeks housing's question rate had halved. Fiona reported this as a win, until the housing director mentioned something at a management meeting. Her officers had been told to phone the one technician they knew rather than "fill in forms that get us ranked". A boiler-control fault across four offices had gone unreported for nine days while officers waited for him to come back from leave. The emergency repair and the tenant complaints cost the council a week of two people's time and a formal apology. The form fix was adding the eleven offices to the location list. It took Fiona twenty minutes once she looked at the question the housing tickets were actually asking. She withdrew the league table and kept the scorecard on her own desk. The housing question rate fell to a tenth the month after the list was fixed, with nobody encouraged to do anything. A number sent to a manager measures the manager's response, not the form.
The Ticket-Quality Scorecard
The scorecard below is the month's reading on one page, filled from the thirty-ticket sample and kept by the person who owns the form. It records the two numbers overall, by channel and by department. It also records the most common missing fact and the fix made this month. It records last month's fix with whether it moved the number, and the reopen rate beside it as the counterweight. The department section is for the desk's eyes and names examples to write, not people to speak to. Fill it on the same day each month, keep every copy, and read the stack once a year.
TICKET-QUALITY SCORECARD — ONE PAGE, MONTHLY
Month: ________   Sample: 30 tickets chosen at random   Read by: ______________

OVERALL
  First reply was a question (Q / 30): ____   Rate: ____
  Exchanges before work started:  median ____   tickets at 2 or more: ____
  Time to workable (open to first work entry):  median ____   longest ____
  Reopened later (counterweight): ____ of 30   Last month: ____

BY CHANNEL                tickets   Q rate   median exchanges   notes
  Web form                 ____      ____        ____            __________
  E-mail                   ____      ____        ____            __________
  Chat                     ____      ____        ____            __________
  Phone                    ____      ____        ____            __________
  Walk-up                  ____      ____        ____            __________
  Form share of all tickets this month: ____   last month: ____

BY DEPARTMENT (desk use only; names the example or label to fix)
  ______________   tickets ____   Q rate ____   fact most often missing: ________
  ______________   tickets ____   Q rate ____   fact most often missing: ________
  ______________   tickets ____   Q rate ____   fact most often missing: ________

THE FACT MOST OFTEN ASKED FOR THIS MONTH
  [ ] which device / where      [ ] what the screen says / photo
  [ ] since when / what changed [ ] anyone else / deadline
  [ ] who this is for           [ ] other: ______________________
  Which part of the intake should have collected it:
  [ ] form label   [ ] form example   [ ] a missing field   [ ] acknowledgment
  [ ] device labels   [ ] location list   [ ] chat question set   [ ] notes at the desk

LAST MONTH'S FIX AND WHAT HAPPENED
  Fix made: ______________________________________  on: ________
  Number it was meant to move: ____________  before ____  after ____
  Verdict: [ ] moved   [ ] no change   [ ] too early to tell

THIS MONTH'S ONE FIX
  Change: ________________________________________________________
  Where: [ ] form   [ ] acknowledgment   [ ] examples   [ ] labels   [ ] channel
  Owner: ____________   Done by: ________
  Number expected to move next month: ____________________________

RULES PRINTED ON EVERY COPY
  Not shared by person or department.  No target on the question rate.
  Read with the reopen rate or not at all.  One fix a month.
Omar filled the first Westmere scorecard the week after the partner's question, from the same ten tickets plus twenty more. The fact most often missing was which device, on e-mail tickets from the fee-earners' floor, where the form had never been bookmarked. His one fix was two lines in the e-mail acknowledgment and a link on every desktop. The next month's form share was up by a third and the question rate on e-mail had fallen by about the same. The partner, who had not been told any of this, mentioned that IT seemed quicker lately. The desk had not got faster. The tickets had started arriving in a state where the desk could begin.
Frequently Asked Questions
What is a good first-reply-is-a-question rate?
Does an acknowledgment that asks for a photo count as a question?
Can we automate the count instead of reading thirty tickets?
Our tickets mostly come by phone and walk-up. Does any of this apply?
Should requesters ever see these numbers?
How long should we keep measuring once the numbers are good?
From the QuerySolv team: we build self-hosted help desk software for Windows. QuerySolv runs as one Windows service on your own network. It takes requests by web form, e-mail, live chat, social messages and REST API. It is licensed once per installation rather than per agent per month. The free trial runs the full product for 30 days.