
Measuring Reopens Honestly Without Fooling Yourself
Two desks compared numbers over lunch at a regional IT meeting. Redbrook Engineering's reopen rate was fourteen percent, and Priya, who ran it, was a little embarrassed about it. Acme's was two percent, and Jonas, who ran that one, was a little pleased. By the end of the sandwich it had emerged that Acme's number counted only reopens an agent had made by hand. That was because its mail integration turned every reply to a closed ticket into a brand-new ticket. Redbrook's number counted every reply including the ones that said "thanks". Neither desk had written down what the number meant, because the tool had produced it and the tool seemed confident. The desks were not two percent and fourteen percent apart. They were measuring different things with the same name.
The reopen rate is the share of tickets the desk marked resolved in a period that the requester sent back, because the fix did not hold. It is the one number a desk has that measures whether "closed" means "fixed". That makes it the most honest metric on the dashboard and also the easiest to corrupt by accident. This article is part of our Reopened Tickets series. The first article sorted reopens into four kinds. This one is about turning the two kinds that matter into a number you can trust from one month to the next.
It covers why the number depends entirely on the definition, then the numerator, which is what counts as a reopen. Next come the denominator, which is what it is divided by and when, and the window, which decides how long after a close a reply still counts. The article covers the thank-you problem and three ways to remove it. It covers cutting the rate by category before by agent, with a worked example that makes the case. It explains what a rising rate, a falling rate and a zero each mean. Then comes the spreadsheet method for a desk whose tool will not do the arithmetic. It finishes with the one-page metric definition that stops the lunchtime argument from ever happening again.
The Number Depends on the Definition
A reopen rate without a written definition is a rumour with decimal places. The same desk, the same month, the same tickets can produce a rate of two percent or twenty depending on four decisions. Those decisions are what counts as a reopen and what it is divided by. They are also how long after the close a reply still counts, and whether thank-you replies are removed. None of those decisions is obvious, and every tool makes them differently. Most desks never find out which choices their tool made until the number moves for no reason and somebody has to explain it in a meeting.
The purpose of the number decides the definition. The reopen rate exists to answer one question: when we say a ticket is fixed, how often are we wrong? Every choice below follows from that. A reply that says the fix failed belongs in the number. A reply that says thank you does not, because the fix held. A reply about a different problem does not, because it says nothing about the fix. A reply six weeks later about the same fault probably does not, because by then a new cause is more likely than a bad fix. That one is a judgement call, though, and the window section below is where the judgement is made.
Write the definition down before computing the first number, and change it rarely. A definition changed mid-year produces a chart with a step in it. And the step will be read as a disaster or a triumph by whoever sees it first. If the definition must change, recompute the old months under the new rule so the chart is one line again, and put a note on the chart saying so. Numbers do not mind being recomputed. People mind being surprised.
The Numerator: What Counts as a Reopen
The numerator is the count of tickets that were marked resolved or closed in the period and were then returned to an open state because the fix did not hold. In the four kinds from What a Reopen Is Telling You, that is kind one, not fixed, and kind two, fixed then broke again. Kind three, a different problem, is excluded because it is a new ticket wearing an old number. Kind four, the thank-you, is excluded because it is not a reopen in any sense a requester would recognise.
Count tickets, not events. A ticket that reopens three times in the period is one reopened ticket in the rate, not three. The question is "how many fixes failed", and one fix failed, repeatedly. Keep the count of reopens per ticket as a separate figure. A ticket with three reopens is the most interesting object on the desk, and the reopen review wants a list of them. But do not let the count of reopens per ticket inflate the rate. A rate that counts events punishes the desk for staying with a hard ticket instead of abandoning it, which is the opposite of what you want.
Count agent reopens as well as requester reopens, when the reason is the same. A technician who reopens a ticket because the requester phoned to say it is still broken has recorded a not-fixed reopen through a different door. Leaving it out because the requester used the telephone would make the rate depend on which channel the requester prefers. A technician who reopens a ticket to correct a note, or because it was closed by mistake while still being worked, has not recorded a failed fix. That one stays out. The classification card in the first article has a line for who reopened the ticket, and the card is where this distinction gets made.
Know what your tool's own reopen count includes before you use it. Many tools count a reopen whenever a requester replies to a resolved or closed ticket, by any channel. The count they report therefore includes the thank-you replies and the different-problem replies along with the real ones. The classification that removes them is the desk's to add, and the section on the thank-you problem below shows how. Other tools count only what an agent does by hand, which is how Acme arrived at two percent. Some count nothing and leave the arithmetic to you. Define the metric so it works whichever kind you have: the tool's number is a starting point, and the definition is yours.
The Denominator: Resolved in the Period, by Resolve Date
The denominator is every ticket marked resolved in the period, counted by the date it was resolved. Not the date it was created, which would put a ticket opened in March and fixed in May into the wrong month. Not the date it was finally closed, which on a desk with a confirmation window is a week or two after the fix and will drift the whole rate by a fortnight. The resolve date is the moment the desk claimed the fix worked. And the rate is a measure of how often that claim was right, so the claim's date is the one to use.
This gives you a cohort, which is a plain word for a group followed together. The tickets resolved in June are the June cohort; the reopens counted against them are reopens of June's tickets, whenever those reopens arrived inside the window. A ticket resolved on 28 June and reopened on 3 July counts in June's numerator, because June's fix failed, even though the reply arrived in July. The single most common mistake in reopen arithmetic is dividing July's reopens by July's resolutions. That makes a bad week at the end of June show up as a bad July. Nobody can find the cause because they are looking in the wrong month.
The cohort method has a cost, which is lag. June's rate cannot be final until the window has closed on June's last ticket. So a seven-day window means June's rate is ready on 8 July, and a fourteen-day window means the fifteenth. Accept the lag and report the month one window late. The alternative is a rate that is quietly wrong for the first week of every month and then changes. And a number that changes after it has been reported is a number nobody trusts twice.
Decide also whether tickets resolved as "cannot reproduce", "no fault found" or "requester did not respond" belong in the denominator. I include them, because the desk claimed the matter was over and the requester can disagree, and a reopen on a "did not respond" ticket is a loud disagreement. Some desks exclude them to keep the rate about fixes. Either is defensible; what is not defensible is doing one thing in March and the other in April.
The Window
The reopen window is the number of days after the resolve during which a requester's reply counts as a reopen of the original fix. Inside it, a reply means the fix did not hold. Outside it, a reply about the same fault is more likely to be a recurrence with a fresh cause. That reply is better handled as a new ticket linked to the old one than as a verdict on a fix that worked for a month. Seven days is the common choice on a desk that fixes things people use daily. Fourteen suits a desk whose requesters use the fixed thing weekly, such as a payroll run or a Monday report. Thirty is too long for almost everyone. By day thirty the ticket's resolver has done two hundred other things and the fault has had thirty days to find a new reason.
The window also interacts with the confirmation window, which is a different thing with a similar name. A confirmation window is the period after a resolve during which the ticket waits in Resolved for the requester to confirm before it moves to Closed. And it belongs to the workflow article on resolved versus closed. The reopen window should be at least as long as the confirmation window. A reply inside the confirmation window is exactly what the confirmation window was asking for. Consider a tool that treats a reply on day six as a new ticket while the original sits in Resolved waiting for a reply. That tool has two settings disagreeing with each other. Set the reopen window first, then set the confirmation window no longer than it.
The picture below shows one ticket over fourteen days with a seven-day window. The resolving reply goes out on day zero. A reply on day two that says "still broken" lands inside the window and counts as a not-fixed reopen. A reply on day five that says "thanks" also lands inside the window and reopens the ticket in most tools. But it is excluded from the rate as a thank-you and the ticket is closed again without a reply. A reply on day twelve that says "it's back" lands outside the window. It becomes a new ticket, linked to the old one so the history is findable. It is not in the rate but it is very much in the weekly review. A fault that returns after twelve days is the second kind of reopen by another name.
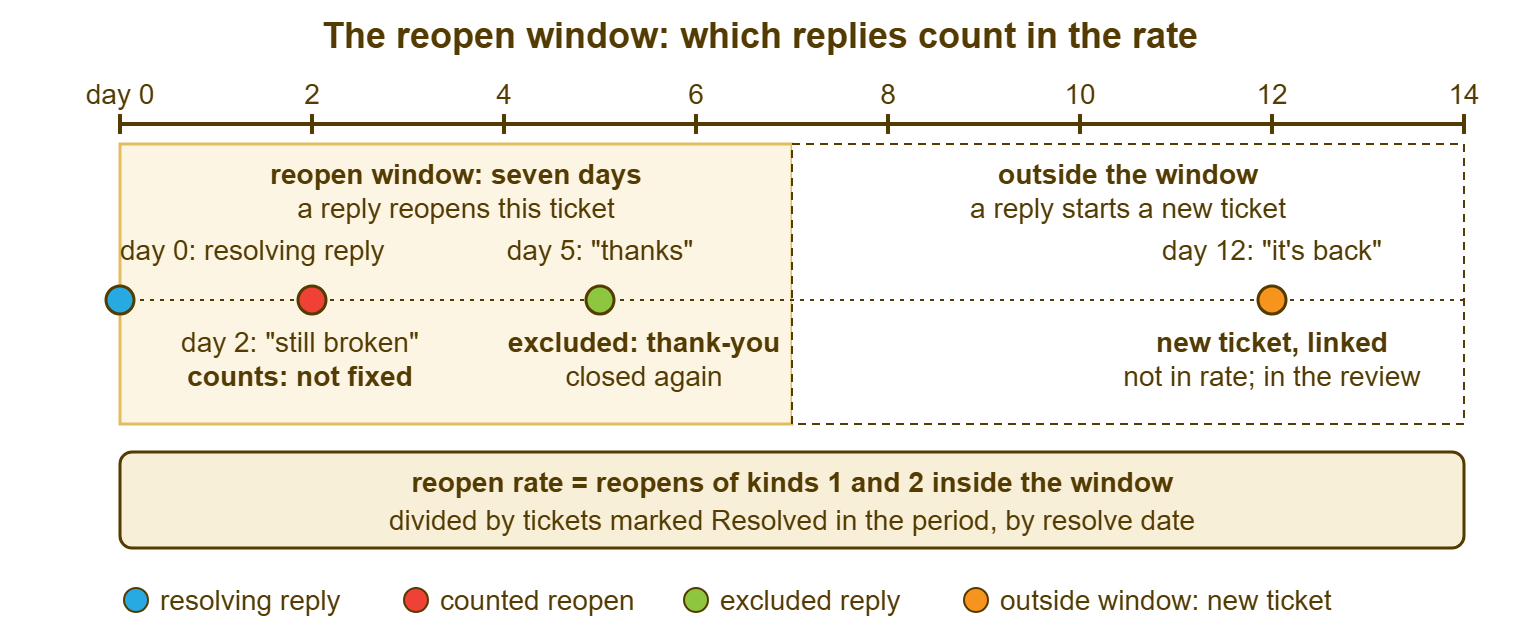
Whatever window you choose, find out what your tool does at the edge of it. Some tools reopen the original ticket on any reply, for ever, and leave the window to you. Some reopen only inside a configured number of days and create a new ticket after that. Some create a new ticket always. Find out which yours is by replying to a test ticket a day after resolving it and again after the window has passed. Then check whether any cutoff the tool applies matches the window in your definition. A tool window of fourteen days and a definition window of seven means the tool will reopen tickets your rate ignores, which is survivable. But the reverse means your rate will look for reopens the tool has already turned into new tickets, and find none.
The Thank-You Problem
On a courteous desk the thank-you replies can outnumber the real reopens, and a rate that includes them measures manners. The problem is mechanical: a tool that reopens on any requester reply cannot read tone. So "Perfect, thank you so much" and "This is still not working" do the same thing to the status. The fix has to come from the desk, and there are three ways to do it, in rising order of effort and accuracy.
The first way is the classification card from the first article, filled in on every reopen, with kind four meaning excluded. It is the most accurate method and the most work. On a desk with fewer than a dozen reopens a week it is also the cheapest. That is because it takes ten seconds per reopen and produces a list the review can use. If your tool lets a ticket carry a note or a field value that the export can see, write the kind there. If not, keep a running sheet with the ticket number and the kind, which is less elegant and works.
The second way is a timing heuristic in the export. A ticket that was reopened and closed again within a short interval, with no agent reply in between, is almost always a thank-you. In that case, the technician saw the gratitude and closed it. A rule such as "exclude reopens closed again within two hours with no public reply" will catch most of them. It will wrongly exclude a small number of real reopens that were fixed instantly, which is a bias in the honest direction. Write the interval into the definition so it does not drift.
The third way is a keyword filter on the reply text, if your export includes it: thanks, thank you, cheers, perfect, great, sorted, resolved, appreciate. It is crude, and it misses "Thanks, but it's still broken". That last case is exactly the one you cannot afford to miss. So if you use keywords, use them to flag rather than to exclude, and let a person look at the flagged ones. A desk that fully trusts a keyword filter will one day exclude the politest furious requester it has ever had.
Automatic replies are a fourth source of noise, and they are easier. An out-of-office message that reopens a ticket is a thank-you with no gratitude in it. And a desk gets several a week in holiday season. Some tools drop auto-replies, bounces and bulk mail before they reach a ticket, and on those desks an out-of-office reopens nothing. If yours does not, add "auto-reply" to the exclusions and ask the mail administrator whether the auto-replies can be identified by header, which they usually can.
Remember: count tickets, not events; divide by tickets resolved in the period, by resolve date. Count only reopens inside the window; remove the thank-yous by a method you have written down. Change any of those four and the chart gets a step in it.
By Category Before by Agent
Cut the rate by category before you cut it by agent, every time. Category explains most of the difference and agent explains almost none once category is accounted for. A category here means whatever your desk uses to say what kind of ticket it was: a department, a form, a custom field, a subject prefix. The reason is not kindness to technicians, though it is kind. The reason is that a rate by agent, read first, points at a person. And a person is the one thing on the list you cannot fix with a setting.
Here is the worked example from Redbrook Engineering, after Priya had removed the thank-yous and applied a seven-day window. The month's 375 resolved tickets had 26 counted reopens, a rate just under seven percent. That was half what the tool had been reporting with the thank-yous in. By category the rate was anything but even.
| Category | Resolved in month | Counted reopens (kinds 1 and 2) | Rate | What it suggested |
|---|---|---|---|---|
| Accounts and access | 140 | 4 | about 3% | Fine; the usual rounding of a healthy category |
| How-do-I questions | 90 | 1 | about 1% | Fine |
| Hardware | 50 | 2 | 4% | Fine |
| Printing | 60 | 9 | 15% | Closing without a test print; mostly kind 1 |
| Design software licensing | 35 | 10 | about 29% | A licence server fault being restarted; all kind 2 |
| Whole desk | 375 | 26 | about 7% | Two categories carry three quarters of the reopens |
Nineteen of the twenty-six reopens were in two categories that together made up a quarter of the work. Printing was closing without a test print, which is a not-fixed pattern and a verification fix. Design software licensing was a licence server that fell over every few days and was restarted every few days. That is a fixed-then-broke pattern and a problem-management fix. Two conversations, neither of them about a person.
Now the agent cut, which Priya ran second. Lena had eleven of the twenty-six reopens, more than anyone else, and on an agent-first reading she was the problem. By category she was also the only technician who understood the design software, so she had taken thirty of the thirty-five licensing tickets. Nine of her eleven reopens were that licence server coming back. Her reopen rate on everything else was below the desk's. The agent cut, read after the category cut, said Lena was carrying the hardest category alone and needed the server fixed, not a conversation about quality. Read first, the same numbers would have produced the conversation and left the server alone.
Cut by channel and by priority between category and agent, if the desk has the volume. Reopens that cluster on e-mail tickets but not web form tickets usually mean the e-mail tickets arrive with less information and get closed on a guess. Reopens that cluster on Low priority usually mean Low is where the desk hurries. Most tools can show a reopen rate over a week, a month or a quarter, and many can compare channels. The cuts a tool cannot make are made in a spreadsheet from an export. That export carries the resolve date, the reopen date, the category, the channel, the priority and the resolving agent. Whatever the tool, the order is category, channel, priority, agent, and agent is last because by then there is usually nothing left for it to explain.
What a Rising Rate Means, and a Falling One, and Zero
A rising rate over three consecutive months means something on the desk has changed, and the category cut will usually say what. A new technician who has not yet learned to verify before closing. A new system that fails in a way a restart hides. A new requester population, such as a department that joined the desk, whose faults are unfamiliar. A change in the closing habit, such as a push to reduce open tickets, which gets tickets closed faster and checked less. The rate does not say which; it says "look", and the category cut says where.
A falling rate is good news only if the denominator did not fall with it and the definition did not change. Check both before anyone is congratulated. A rate that fell because the desk stopped marking tickets resolved, leaving them open to avoid the reopen, shows up as a falling rate and a rising open count. And the two charts side by side tell the truth that either alone would hide. Suppose the rate fell because the mail integration started creating new tickets for replies to closed ones. That shows up as a falling rate and a rising count of second tickets from the same requester within a week. That is a harder thing to see and worth a monthly query.
A rate of zero is not a target and should not be celebrated. It means that for a whole period no requester disagreed with a single close. On a desk of any size that means either that replies are no longer reopening tickets or that nobody is replying. The first is a tool setting. The second is the silent failure described in how support quietly fails: requesters who have stopped telling the desk when it is wrong, and will shortly stop telling the desk anything. A desk with a reopen rate of zero should be nervous. A desk with a small, steady, explained rate should sleep well.
Computing It in a Spreadsheet
If your tool reports a reopen rate whose definition you can read and agree with, use it, and skip this section. If it reports a number whose definition is a mystery, or no number at all, the spreadsheet method takes twenty minutes the first month and five thereafter. Export the period's tickets with at least these columns: ticket number, resolve date, the date of the first reopen if any, the category, and the agent who resolved it. Add a column for the kind, filled from the classification cards or the timing heuristic.
Then two formulas. In a new column, mark each ticket as a counted reopen if it has a reopen date, the reopen fell inside the window, and the kind is one or two. With the resolve date in column B, the reopen date in column C and the kind in column D, the formula for the first data row in most spreadsheets is:
=IF(AND(C2<>"", C2-B2<=7, OR(D2=1, D2=2)), 1, 0)
Fill that down the column and call it E. The rate for the period is the sum of column E divided by the count of resolve dates in column B. A pivot table on category against column E gives the category cut. The same pivot on agent gives the agent cut, which you will run second. Keep the month's export and the filled sheet together, because the review article wants to see three months side by side. And the day somebody questions the number, the sheet is the answer.
Two checks before trusting the result. First, sort by column C minus column B and look at the tickets with a gap of exactly zero days. Some tools record a reopen when an agent reopens a ticket closed seconds earlier by mistake, and those are not failed fixes. Second, look at every ticket with two or more reopens, because the formula counts each once and you want to know which they are. Both checks take a minute and both find something most months.
A Short War Story: The Clean Number at Stonebridge Insurance
Stonebridge Insurance's four-person desk reported a reopen rate under two percent for a full year. The number went into the quarterly pack each time with a small green arrow beside it. Marcus, newly made team lead, spent a month merging second tickets from the same requester into their originals. He found that the mail integration had been creating a new ticket for every reply to a closed one. So the tool's reopen count had only ever seen the handful an agent reopened by hand. Recomputed honestly, the rate was closer to one in six. Most of the hidden reopens were in the claims system category, where a nightly job failed roughly weekly. The job had been restarted forty-one times by four different people who each believed they were seeing it for the first time. The permanent fix, once the pattern was visible, was a configuration change that took an afternoon. The year of a clean number had cost forty-one restarts and a weekly morning of claims staff working from paper. It had also cost a quarterly pack that had been confidently describing the mail integration.
The Reopen Metric Definition
The definition below is one page, and its job is to make the lunchtime argument impossible by answering every question before it is asked. Fill it in once, have the person who owns the number sign it, and keep it next to the chart it describes. The ticked boxes are the choices this article recommends. Change them if your desk has a reason. Write the reason in the margin so that next year's team lead knows it was a choice and not an accident.
REOPEN METRIC DEFINITION — ONE PAGE
Desk: ______________  Owner of this number: ____________  Last reviewed: ________

NAME AND QUESTION
  Reopen rate.  When we mark a ticket resolved, how often are we wrong?

NUMERATOR — WHAT COUNTS AS A REOPEN
  A ticket marked Resolved or Closed that returned to an open state,
  whether the requester replied or an agent reopened it, because the
  fix did not hold.
  Kinds counted:    [x] not fixed        [x] fixed, then broke again
  Kinds excluded:   [x] a different problem (split to a new ticket)
                    [x] thank-you or automatic reply
  Each ticket counts once, however many times it reopened.
  Window: counted only if the reopen falls within ____ days of the resolve.

DENOMINATOR — WHAT IT IS DIVIDED BY
  All tickets marked Resolved in the period, by resolve date
  (not by created date, not by close date).
  Tickets resolved as cannot reproduce / no response:  [ ] included  [ ] excluded

PERIOD AND LAG
  Period: calendar month.  Reported ____ days after the month ends (one window).

HOW THANK-YOU REPLIES ARE REMOVED
  [ ] classification card or kind note on every reopen
  [ ] closed again within ____ hours with no public reply = excluded
  [ ] keyword flag on reply text, reviewed by a person before exclusion
  [ ] automatic replies dropped by the tool / identified by header

CUTS, IN THIS ORDER
  1. category or ticket type   2. channel   3. priority   4. agent (last)

SOURCE
  Export from: ______________   Fields: number, resolve date, reopen date,
  kind, category, channel, priority, resolving agent

WHAT WE DO WITH IT
  Reviewed weekly in the reopen review by: ____________
  A move of more than ____ points month on month triggers: ______________
  Tickets with two or more reopens are listed separately every week.

WHAT IT DOES NOT MEASURE
  Fix quality on tickets that are never marked resolved.  Speed.
  Satisfaction.  Anything about an individual without the category cut first.
The last block is the one most definitions leave out and the one that saves the most trouble. A number that states what it does not measure cannot be stretched to cover it in a meeting. Somebody may ask whether the reopen rate shows that the desk is slow, or that requesters are unhappy, or that Lena needs coaching. The page already says no, and says it in writing, in advance, with a signature.
Priya and Jonas, at the next regional meeting, had both filled in the page. Redbrook's rate had come down to seven percent by definition and then to five by fixing the licence server. Acme's had gone up to nine percent by definition, which Jonas presented as the best news his desk had had all year. For the first time Acme's rate was a number about fixes. They were two points apart, measuring the same thing, and the sandwich was much more relaxed.
Frequently Asked Questions
Should the window be seven days or fourteen?
Our tool's reopen count includes thank-you replies. Is it useless?
Should we count a ticket reopened three times as three reopens?
Why divide by tickets resolved rather than tickets closed?
Is it fair to show the reopen rate per agent at all?
Our rate jumped this month and nothing changed. What do I check?
From the QuerySolv team: we build self-hosted help desk software for Windows. QuerySolv runs as one Windows service on your own network. It takes requests by web form, e-mail, live chat, social messages and REST API. It is licensed once per installation rather than per agent per month. The free trial runs the full product for 30 days.