
What a Hotspot Is: The Few Sources Behind Most of Your Tickets
Tuesday, 09:10, at Meridian Parts. Dev runs the four-person desk for an automotive parts distributor. He has the monthly category report open because the operations director likes to see it. Hardware is the top category, a little over a fifth of last month's tickets. It was the top category last month too, and the month before. Nothing to see. Across the room Marcus is on a ticket that reads "laptop keeps dropping off the Wi-Fi when it's in the dock". It is his third ticket this week from the same model of laptop. He says so, out loud, to nobody in particular. Dev says "it's always something with those" and goes back to the report. The report has no column for laptop model. It has a column for Hardware, and Hardware looks the way it always looks.
The number nobody at Meridian has is this one. Of the six hundred tickets the desk closed last quarter, sixty-six came from nineteen machines. That is about one ticket in nine from under a tenth of a two-hundred-laptop fleet. A hotspot is a single source that produces tickets out of all proportion to its size. It is one model of device, one application, one business process, one location, or one group of people. The tickets are the symptoms. The hotspot is the thing making them. This article is part of our Hotspot Analysis series. The series covers finding hotspots in the ticket data, device and model hotspots, and application and process hotspots. It also covers killing the source rather than the symptoms, and the quarterly review that keeps the hunt going.
It covers what a hotspot is and why it is a source rather than a symptom. Next comes the few-sources-most-tickets idea in plain words, with a picture. Then we cover the five kinds of hotspot, why hotspots hide inside categories, and the difference between hot and big. We turn to what a hotspot is not and what finding one buys the desk. We finish with a short war story and the hotspot definition card to copy, in that order.
A Hotspot Is a Source, Not a Symptom
A ticket describes a symptom, and the category on it names the kind of symptom, but neither says what produced it. "Laptop drops off the Wi-Fi in the dock" is a symptom. "Battery lasts ninety minutes" is a symptom. "Screen flickers on the external monitor" is a symptom. At Meridian these three were filed under Network, Hardware and Hardware, by three different technicians, and were resolved three different ways. The source of all three was one laptop model, and the source is what a hotspot names. A source produces tickets of several kinds. That is exactly why a hotspot is always bigger than any one of its symptoms. It is also why a desk that only ever counts symptoms will never see it.
The test for a source is a question: if this thing vanished tomorrow, which tickets would stop arriving? If the nineteen laptops were replaced tonight, the Wi-Fi tickets, the battery tickets and the flicker tickets from those machines would all stop. So would a handful of "it's slow" tickets that nobody had connected to the model at all. Those are the hotspot's tickets. The question is worth asking out loud at the desk, because the technicians usually know the answer by feel. They have never been asked for it in a form that could be counted. Marcus knew. Marcus had been saying so, to nobody in particular, for most of a year.
A source is not the same thing as a cause, and the difference decides which article you need. Problem management asks why one repeating incident happens and hunts for its root cause. The laptop's Wi-Fi drop has a cause (a dock firmware fault, say) and the battery complaint has a different one. Each might deserve its own problem record, which is the business of Finding the Repeat Tickets. Hotspot analysis asks a wider and blunter question: which thing is producing the most tickets of all kinds, and what would it take to stop? The answer at Meridian was not a firmware fix. It was nineteen new laptops. No amount of root-cause analysis on the Wi-Fi driver would have reached that answer, because the Wi-Fi driver was only a third of the problem.
The Few-Sources-Most-Tickets Idea in Plain Words
Sort a quarter's tickets by the thing that produced each one. And the list is always the same shape: steep at the top, long and flat at the bottom. A handful of sources make a large share of the tickets, and then dozens of sources make a few each. This is sometimes called the Pareto principle, after the economist who noticed the same shape in land ownership. And it is sometimes quoted as a law with exact proportions attached. Do not trust the exact proportions; they are different on every desk. A desk that expects a particular split will find it whether it is there or not. Trust the shape. The shape is reliable because it comes from how organisations are built. A few things are used by everyone every day, and most things are used by a few people occasionally.
Meridian's quarter, drawn below, is the fictional example this series uses throughout. Six hundred tickets came from fifty-eight distinct sources once the desk had worked out what each ticket was really about. The top eight sources produced three hundred and twelve of them, half the quarter. The sources were one laptop model, the expenses application around month-end, and the Wi-Fi in the east hall of the warehouse. The others were the onboarding of new starters, the second-floor printers, the VPN from home, the finance shared mailbox and the meeting-room screens. The remaining fifty sources shared the other half, and none of them produced more than ten tickets. Fifty things, each a nuisance, none a project.
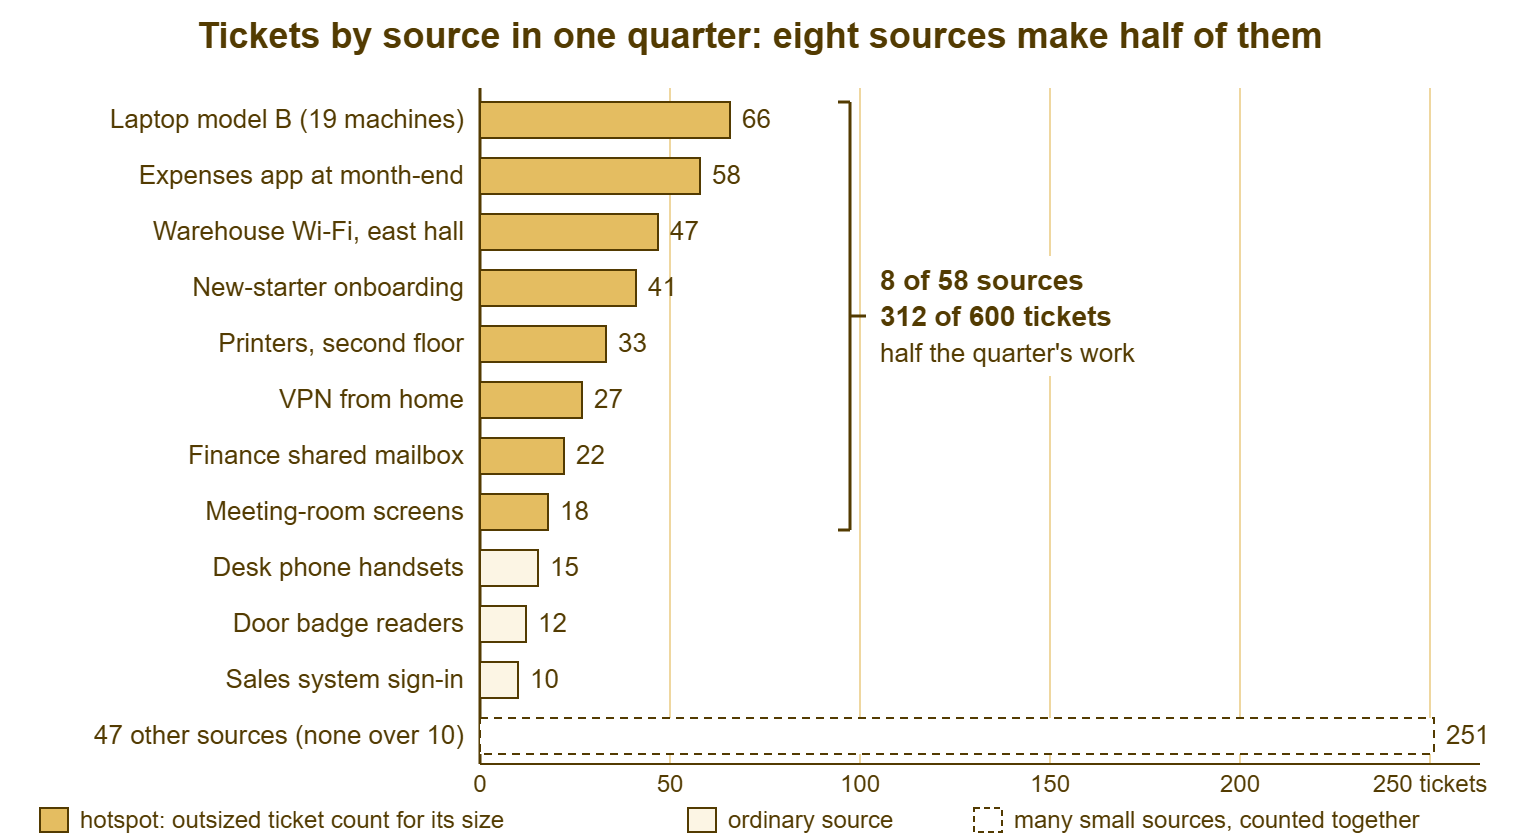
The shape matters because it tells you where effort pays. Removing one source at the top of the list removes every ticket it was producing, of every symptom, for every month afterwards. Removing a source from the bottom of the list removes four tickets a quarter, and there are fifty such sources. So working the tail means fifty small projects to get the same result as one large one. The desk lives in the tail all day, because the tail is where the variety is and variety is what fills a working day. The hours are at the head. That is the whole argument for looking at tickets by source rather than one at a time. And it is also why the looking has to be deliberate. Nobody notices the head of the list from inside the queue. The queue serves tickets in the order they arrive, which is to say shuffled.
The tail is not nothing, and a hotspot hunt that sneers at it has misunderstood the picture. Two hundred and fifty-one tickets is two hundred and fifty-one people who needed help, and the desk's job is to help them well. The point is only that the tail cannot be fixed as a tail. It is fixed, slowly, by the ordinary work of the desk: a knowledge base article here, a scripted fix there, a better form. The head is different. The head can be fixed on purpose, in one move, with a budget line and a date. And that is what the rest of this series is about.
The Five Kinds of Hotspot
Hotspots come in five kinds, and the kind decides who you will have to talk to in order to remove it. A device hotspot is a model, a batch or a room's worth of equipment that fails more than its peers. Examples are the laptop model, a delivery of docking stations with a bad power supply, or the kit in the training room. An application hotspot is a piece of software that generates tickets either by fault or by design. And "by design" is commoner than people expect. Take an application that requires a permission request through the desk every time a user needs a new report. It is a hotspot that works exactly as its vendor intended. A process hotspot is a business routine that breaks the same way every time it runs. Examples are onboarding, expenses, month-end close or the annual appraisal cycle. A location hotspot is a site, a floor or a hall whose tickets come from where it is rather than what it uses. Examples are the warehouse's east hall, the branch with the flaky line, or the office on the floor with the old cabling. A group hotspot is a department or role whose work hits the desk harder than its headcount would predict. That is usually because of what the group uses rather than who they are.
The five kinds overlap, and that is fine. The east hall's Wi-Fi tickets are a location hotspot. They could also be filed as a device hotspot (the access points) or a group hotspot (the pickers who work there). Pick the kind that names the thing you would have to change. If the fix is new access points, it is a device hotspot. If the fix is cabling, it is a location hotspot. If the fix is giving the pickers handhelds with a different radio, it is a group hotspot. The kind is a label for the conversation, not a taxonomy to defend. (Taxonomies, in my experience, are defended most fiercely by the people who will never use them.)
| Kind of hotspot | What it looks like in the tickets | The question that reveals it | Who you will need to talk to |
|---|---|---|---|
| Device or model | Many symptoms, one model or batch; often one room or one delivery date | Tickets per machine, by model, compared with the other models | Whoever buys and replaces equipment |
| Application | Access, permission and "it says an error" tickets with one application's name in them | Tickets per user of the application, compared with other applications | The application's business owner, and sometimes the vendor |
| Process | A cluster of tickets on the same days each month or each cycle, from the people who run the routine | Tickets per run of the process, and when in the cycle they land | The owner of the process, usually outside IT |
| Location | Connectivity, power and printing tickets from one site or floor, across all device types | Tickets per person at the site, compared with other sites | Facilities, the network owner, the site manager |
| Group | One department or role raising tickets well above its share of headcount | Tickets per person in the group, then what the group uses that others do not | The group's manager, with the real source underneath |
Note what is not in the table: the technician. A hotspot is about what produces tickets, and a technician resolves them. So a per-technician cut has no place in a hotspot hunt and will mislead the moment it is tried. The technician who takes the most laptop tickets is the one who knows laptops. If a desk ever looks at tickets per technician for any reason, that number is for coaching and never for ranking. It should not be read at all from fewer than a few dozen tickets per person over a quarter. Below that it is noise with a name on it. The group kind means requesters. It never means staff.
Why Hotspots Hide Inside Categories
Categories are organised by symptom because the symptom is what the triager can see at the moment of filing. A new ticket says "the Wi-Fi keeps dropping". So it goes under Network. "The battery is dead by lunch" goes under Hardware. "The second screen flickers" goes under Hardware too, or Peripherals, depending on who is triaging and how their morning is going. A source spreads its tickets across every symptom it can produce, and so across every category those symptoms belong to. The nineteen laptops at Meridian appeared in five categories. In each one they were a minority, somewhere between a tenth and a quarter of the category's tickets. A minority in five places is invisible in all of them. Add the five minorities together and they are the top line of the quarter.
The category report is honest and, for this purpose, useless. "Hardware, twenty-one percent" tells you the kind of thing that broke, which is what categories are for, and nothing about which thing. The report cannot say "model B" because the category tree has no row for model B. And the tree should not have one. A category tree that names every model and every application is the four-hundred-category monster that nobody can file into. The information that reveals a hotspot lives elsewhere on the ticket. It is in the asset tag field, the requester's department, the site, or the application named in the text. Categories answer "what sort of problem"; hotspots are found by asking "which thing". The two questions need different columns, which is the argument of Categories That Make Reports Worth Reading.
Time hides hotspots too. A process hotspot shows up for three working days a month, when the expenses run happens, and is absent for the other nineteen. A weekly view of the queue sees a busy few days and then calm, and calm is what gets remembered. Only a view across several months shows the pattern, with the days lined up by their place in the cycle. The same three days are busy every month and busy with the same thing. The desk at Meridian had experienced three years of bad month-ends and described each one as "a bit of a week".
The last hiding place is the one most desks never check: the ticket that was never filed as anything useful at all. "Other" is a category, and so is "General", and so is the blank left by a form with no required field. If a quarter of the desk's tickets sit under Other, the hotspot can be entirely inside Other. In that case, it can be the largest single thing the desk does, with no report able to say so. The fix for that is upstream, in how tickets are categorised at close rather than at open. Until it is fixed the hotspot hunt has to read the tickets themselves. Reading tickets is slower than reading a report. It is also the only method that works on a desk whose reports lie.
Remember: a hotspot is a source, not a symptom and not a category. It is found by asking "which thing produced this ticket" across every ticket, not by reading the top category. A source spreads its tickets across many categories and is a minority in each of them.
Hot Versus Big: Size Against Expectation
A big source is not a hotspot. Meridian has a hundred and fifty laptops of model A and nineteen of model B. Over the quarter, model A produced ninety tickets and model B produced sixty-six. So model A is the bigger source by raw count and appears above model B in a list sorted by tickets. Divide by the number of machines and the picture inverts. Model A produced six tickets per ten machines over the quarter, and model B produced about thirty-five per ten. Model B is making tickets at nearly six times the rate of its peers. Model A is making tickets at the rate a laptop makes tickets. The first is a hotspot. The second is a fleet.
The measure that finds a hotspot is therefore a rate, tickets per unit of size, compared with the rate of its peers. The unit depends on the kind. It is tickets per machine for a device, per user for an application, and per run for a process. It is per person on site for a location, and per person in the group for a group. The comparison is against things of the same kind, because every kind has its own normal rate and a printer's normal is not a laptop's. The arithmetic is the sort that fits on the back of a ticket. Meridian's sales team of forty people raised eighty tickets in the quarter, two each. The warehouse, sixty people, raised ninety-five, about one and a half each. Finance, twelve people, raised fifty-four, four and a half each. The warehouse is the biggest source of the three. Finance is the hotspot, and underneath finance were the expenses application and the finance mailbox. That is the usual story: a group hotspot is a thing hotspot wearing a department's name.
A hotspot needs both conditions: a rate well above its peers and a count large enough to be worth a project. A single machine with nine tickets in a quarter has an enormous rate and belongs on the lemon list. That is a per-device tool and lives in Tickets as Asset Intelligence. For that one machine, the fix is to replace it, not to run an analysis. A hotspot is usually a class of thing, and the count is what makes it worth a class-sized fix. Take a working range from Meridian's size of desk, about two hundred tickets a month. A source running at two to three times the rate of its peers and producing ten or more tickets a month is worth the card. The card is at the end of this article. Below that working range, a source is worth a note and another look next quarter. The thresholds are yours to set; the two conditions are not.
What a Hotspot Is Not
An outage is not a hotspot. Sixty tickets in one afternoon because the mail server stopped is an incident, one event with one cause. It is handled by the incident process and over by evening. A hotspot persists: it is there in January and in March and in June, at a rate that does not depend on anything having gone unusually wrong. The two can be confused in the data, because an outage puts a spike into whatever source it belongs to. That is why the hotspot hunt counts across a quarter and takes known incidents out before reading the list. One bad afternoon is weather. The same bad afternoon every month is a hotspot.
A busy season is not a hotspot either, though it can contain one. Consider September at a school, year-end at a finance team, or the week before a trade show at a parts distributor. The whole desk gets busier, from every source. The list sorted by source keeps roughly its shape at a larger scale. That is volume, and it belongs to the ticket volume series rather than to this one. The tell is proportion. If every source rises together, it is the season. If one source rises while the rest hold, it is a hotspot that has a season, like the expenses application. The expenses application is a hotspot for three days a month and a model citizen the rest of the time.
A person is not a hotspot. Every desk has a requester who raises more tickets than anyone else in the building. And every desk has at some point had a quiet laugh about it, and the laugh is pointed in the wrong direction. A frequent requester is almost always a group hotspot of one. That might be a role that uses something awkward, a location with bad kit, or a process that routes through their desk. Count their tickets by source like anyone else's and the thing behind them appears. The one exception is the requester who raises tickets that are really training requests. And the fix for that is not a hotspot fix; it is a conversation and a knowledge base article, kindly done.
What Finding One Buys You
Hours, first. Sixty-six tickets a quarter at Meridian took the desk somewhere between thirty and fifty hours of hands-on time over the quarter. That depended on how the Wi-Fi ones went. The tickets took the nineteen requesters a similar amount of time waiting and rebooting. Over a year that is between a hundred and twenty and two hundred technician hours, which is several working weeks, from one model of laptop. The case for replacing the nineteen machines is built from those hours, in the way the fourth article in this series describes. And it is a short case, because the hours are already in the tickets and the tickets are already closed. Nobody has to estimate anything. They have to count.
A sentence, second. "One ticket in nine comes from nineteen laptops" is a sentence an operations director understands in the time it takes to say. It is a different kind of sentence from "Hardware is our top category". The first names a thing, a number and an implied decision; the second describes the weather. "Our hotspot is Hardware" means nothing can be done, because nobody can replace Hardware. "Our hotspot is model B, nineteen machines" is a sentence with a purchase order inside it. The translating of ticket counts into sentences that lead to decisions is its own craft, owned by Translating Tickets Into Business Language. And a hotspot is the easiest raw material that craft ever gets, because it arrives already pointed at something.
A plan, third, and this one is for the desk rather than for management. Technicians know the hotspots by feel long before anyone counts them. The feel comes out as grumbling, which is the lowest-value form a true fact can take. Counting turns the grumble into a line on a list, the list into a quarterly ritual, and the ritual into one source removed every three months. Marcus has been right about the laptops for most of a year. The count is what makes him right in a way the desk can act on.
The counting needs the right columns on the ticket, and most of them are already there. The requester's department is on nearly every ticket in every tool; the site usually is. The application is in the text or in a field; the device is wherever the desk keeps its asset tag. If you run QuerySolv, the standard volume reports already give you the cut by department, which is one of the five kinds. In that case, the device and application cuts come from the fields on your own forms and a spreadsheet. That is the subject of the next article, Finding Hotspots in the Ticket Data. No tool finds the hotspot for you. Every tool gives you the tickets, and the tickets already know.
A Short War Story: The Medication Carts at Harbourview Clinic
Harbourview Clinic ran a desk of two for a community hospital. For fourteen months its tickets included "cart won't connect to the network", "cart battery dead by afternoon", "cart screen frozen" and "cart scanner not reading barcodes". These were filed under Network, Hardware, Hardware and Peripherals respectively, each a modest share of its category. The carts were eleven medication trolleys of one model with a built-in tablet, on two wards. In the fourteen months they produced about a hundred and sixty tickets, roughly a quarter of everything the wards raised. This cost the desk around eight hours a month and cost the nursing staff a walk to the desk each time. A replacement budget for the carts had been declined the year before on the grounds that "the carts are fine". That judgement was made from the category report, in which they were. A new technician called Sam asked in her second week why there were so many cart tickets. She found that nobody could say how many, and spent an afternoon counting from the ticket text. The one-page result went to the clinical director, who approved the replacement within the month. A hotspot nobody has counted is a hotspot nobody can fix. And it had cost the clinic a year of ward time to learn it.
The Hotspot Definition Card
The card below describes one hotspot on one page, in the terms this article has defined. It is the unit the rest of the series works with. The hunt in the next article produces cards, the fix articles act on a card, and the quarterly review reads the cards side by side. Fill in the size and the rate honestly, including the peer rate, because the comparison is what makes it a hotspot rather than a big source. The "hides in" line lists the categories the source's tickets were filed under, which is useful twice. It tells the next person where to look, and it is a quiet argument for better columns. Keep one card per source, and keep the finished cards; the cooled ones are the record of what the desk has removed.
HOTSPOT DEFINITION CARD — ONE SOURCE, ONE PAGE
Hotspot name: ___________________________________   Card ID: ________
Kind: [ ] device/model  [ ] application  [ ] process  [ ] location  [ ] group
Prepared by: ______________   Date: ____________   Period counted: ____________

WHAT IT IS
  The source, precisely (model, app, routine, site, group): ______________________
  Size (machines / users / runs / people): ______
  Who uses it or runs it: ___________________________________________________

WHAT IT PRODUCES
  Tickets in the period: ______     Tickets per month: ______
  Symptoms it shows up as:
    1. _______________________________________  filed under: ______________
    2. _______________________________________  filed under: ______________
    3. _______________________________________  filed under: ______________
  Known incidents removed from the count: ___________________________________

HOT OR JUST BIG
  Rate (tickets per unit of size, per month): ______
  Peer rate (same kind of thing, same period): ______
  Rate compared with peers: about ______ times
  Counts as a hotspot?  [ ] yes, both conditions  [ ] watch  [ ] no, just big

WHAT IT COSTS
  Hands-on hours per ticket (sample of ten): ______ to ______
  Desk hours per month: ______ to ______
  Requester time per ticket, if known: ______

WHO OWNS THE THING
  Owner of the source (not the desk): ______________________
  Spoken to on: ____________   Their view: __________________________________

STATUS
  [ ] identified  [ ] case being built  [ ] fix agreed  [ ] fix done, watching  [ ] cooled
  Next review date: ____________
Dev filled in the first card at Meridian on the Tuesday afternoon, for model B, with Marcus reading the ticket text aloud while Dev counted. It took two hours, most of it spent working out which "slow laptop" tickets belonged to the model. The rate line came out at nearly six times the peer rate. Dev wrote it down, read it back, and then checked it a second time, because it looked like a mistake. It was not a mistake. It was most of a year of Marcus being right.
Frequently Asked Questions
How many tickets does a source need before it counts as a hotspot?
Is a user who raises a lot of tickets a hotspot?
Our categories are well designed. Do we still need a separate hotspot hunt?
What is the difference between a hotspot and a problem record?
What if the hotspot is something we cannot change, such as a supplier's application?
How often should we rebuild the list of hotspots?
From the QuerySolv team: we build self-hosted help desk software for Windows. QuerySolv runs as one Windows service on your own network. It takes requests by web form, e-mail, live chat, social messages and REST API. It is licensed once per installation rather than per agent per month. The free trial runs the full product for 30 days.