
Finding Hotspots in the Ticket Data: The Cuts and the Pivot
Thursday, 16:30, at Northgate Retail. Imani runs a desk of three for a chain of thirty shops and a head office. She has just done the thing she has been meaning to do for a year. She has exported every ticket the desk closed last quarter to a spreadsheet. One thousand eight hundred and forty rows: ticket number, opened, closed, category, requester, department, site, subject and resolution note. She sorts by category, and Hardware is at the top, which she knew. She sorts by site, and Head Office is at the top, which is where most of the people are. She sorts by requester and finds that the deputy manager at the Harbor Street store has raised forty-one tickets. That tells her something about Harbor Street and nothing about what to do. There is no column that says "which thing broke". That column is the one she needs, and she is going to have to build it.
Finding hotspots is the systematic cut: taking a period's closed tickets and counting them four ways. Those ways are by device, by application, by location and by group of requesters. The aim is for the few sources producing most of the tickets to stand out from the many producing a few. The previous article, What a Hotspot Is, defined the thing being hunted; this one is the hunt. It is a spreadsheet exercise. It takes an afternoon the first time and a couple of hours each quarter after that. It needs no tool beyond the one that exported the tickets. This article is part of our Hotspot Analysis series, and it is deliberately narrow. The hunt for the same incident repeating under different numbers, which feeds a problem record, is a different search. It has its own article, Finding the Repeat Tickets. This article finds sources, not repeats.
It covers starting from closed tickets rather than the queue, then the four cuts and what each needs. Building the "which thing" column comes next, followed by the pivot table in plain words, with a picture. Then come reading the top-ten lists and turning counts into rates with a size column. The article covers the traps that make a cut lie and what to do with the candidates. A short war story and the hotspot hunt worksheet to copy follow, in that order.
Start From Closed Tickets, Not the Queue
The hunt runs on closed tickets from a whole period. That is because the queue shows what is waiting and a hotspot is a pattern in what is done. Open tickets are a few days' worth of work, biased towards whatever is hard. Closed tickets over a quarter are the desk's actual output, in the proportions it actually happened. A quarter is the right period for a first hunt because it holds three month-ends and three cycles of anything monthly. It holds enough tickets that a source producing ten a month shows up as thirty rather than as a bad week. A month is too short. A year is fine for a desk that has one, but the first hunt should not wait for it.
Export the whole period to a spreadsheet, every ticket, every column the tool will give you. Most help desk tools can export a list of tickets to a spreadsheet file. Some produce a report by department or category without the export, which is a useful first look and is not the hunt. That is because the hunt needs the subject and resolution note of each ticket, and reports do not carry those. If you run QuerySolv, the standard reports already give you volume by department. Its REST API will hand the ticket list to a script for a desk that prefers to pull the data rather than click for it. Either way the cut itself happens in the spreadsheet. The spreadsheet is the great leveller. An export from the most expensive suite in the world and one from a free tool look the same in a pivot table.
Check the columns before you start, because the cut can only be as good as the fields on the ticket. Four columns do most of the work: the requester's department, the site, the subject line and the resolution note. Two more are a gift if present: a device tag or model, and an application name. If the device is not a field, it is in the resolution note if the desk writes decent notes and nowhere if it does not. The ways of getting a device onto a ticket without an asset system are in Linking Devices Without an Asset System. The first hunt usually ends with the desk adopting one of them. Imani's export had a device tag on about a third of the hardware tickets, because one technician wrote it down and two did not.
The Four Cuts
A cut is the whole list of tickets counted by one column, so that each distinct value in the column gets a count. Cut by site and you get one line per shop with its ticket count; cut by department and you get one line per department. The hunt makes four cuts, one for each kind of hotspot that lives in a column: device, application, location and group. The fifth kind, the process hotspot, has no column of its own, because a process is a pattern in time. It is found from the other four cuts plus the calendar, as the fourth article in this series describes. The order is location, group, device, application. That is because the first two use columns the tool already filled in and the second two usually need the column built.
Each cut has a column it needs, a place that column comes from, and a trap it falls into, and the table below lists them. The location and group cuts are nearly free, because the site and department come from the requester's record. They were filled in by the tool rather than by a tired person. The device and application cuts cost an hour or two of reading. That is because the thing that broke is in the words of the ticket and not in a field. Do not skip the expensive cuts. The cheap ones find the department. The expensive ones find the thing the department is struggling with, and the thing is what gets fixed.
| Cut | Column it counts | Where the column comes from | What the top-ten list shows | The trap |
|---|---|---|---|---|
| Location | Site, building or floor | The requester's record; sometimes a form field | Which places raise the most tickets | A default value (usually head office) that was never changed for remote or e-mail requesters |
| Group | Department or role | The requester's record; the directory | Which departments raise the most tickets | Big departments top the list by size alone; a department that files on behalf of others inflates its count |
| Device | Model, or asset tag mapped to a model | A tag field if the desk has one; otherwise the resolution note | Which models and batches produce tickets | Missing tags on most tickets; the same model spelled four ways |
| Application | The application named in the ticket | A field on the form if there is one; otherwise the subject and note | Which applications produce tickets, and of what kind | Tickets that name the symptom ("can't log in") and not the application; one application under three names |
Building the "Which Thing" Column
The device and application cuts need a column the export did not have. Building it means reading tickets and typing a short label into a new column beside each one. Add two columns to the spreadsheet, headed Device and Application, and work down the rows reading the subject and the resolution note. "Laptop drops Wi-Fi in dock, asset NR-0412, reseated dock firmware" gets a device label of the model that tag belongs to and an application label of none. "Can't submit expenses, error on save, cleared browser cache" gets an application label of the expenses system and no device. Most tickets get one label or the other; some get both; a fair number get neither. That is a finding too, which the traps section comes back to.
Pick one spelling for each label and write it on a list beside you, because the pivot counts spellings, not meanings. "Expenses", "expenses app" and "the expense system" are three sources to a spreadsheet. Imani kept a short list on paper: the model names as the supplier wrote them and the applications as the business calls them. It also had a rule that anything she could not place went down as "unclear" rather than being guessed. The list becomes the desk's vocabulary for the next hunt. It is a good candidate for a drop-down on the form, so that next quarter the column arrives already filled. The first hunt builds the column by hand. A good desk makes sure it never has to again.
Budget the reading honestly. A practised reader labels three to four hundred tickets an hour when the notes are decent, and half that when the notes say "fixed" and nothing else. Imani's rows took her and Theo a little over three hours between them, with the radio on. For a desk whose quarter runs to several thousand tickets, label a sample instead. To do that, sort the export by ticket number. Take every third or every fifth row until you have six to eight hundred, and label those. The proportions in a sample that size are close enough to the whole for a hunt. The whole can be labelled next quarter once the form has a field. Do not sample by category, because the point is to find what the categories hide.
Keyword rules can do part of the labelling. If the subject or note contains the expenses system's name, label the application. If it contains an asset tag, look the tag up and label the model. A spreadsheet applies rules like that with a search-in-text function, and they get the easy two-thirds. The remaining third is where the hotspot usually is. That is because the ticket that says "it's slow again" and nothing more is disproportionately from the source everybody is sick of. Read those by hand.
The Pivot in Plain Words
A pivot table is a count of rows grouped by the values in one column, and that is all it is. Put the Device column in as the rows and the ticket number in as the thing to count. The pivot produces one line per device label with the number of tickets beside it. That is the device cut done in four clicks. Every spreadsheet has the feature under a name like pivot table or summary table. If yours does not, the same result comes from sorting by the column and counting the runs. That is how people did it before pivots existed and is fine for a few hundred rows. The pivot's one trick worth learning is that it can group by two columns at once, one down the side and one across the top. That two-way grid is where hotspots stop hiding.
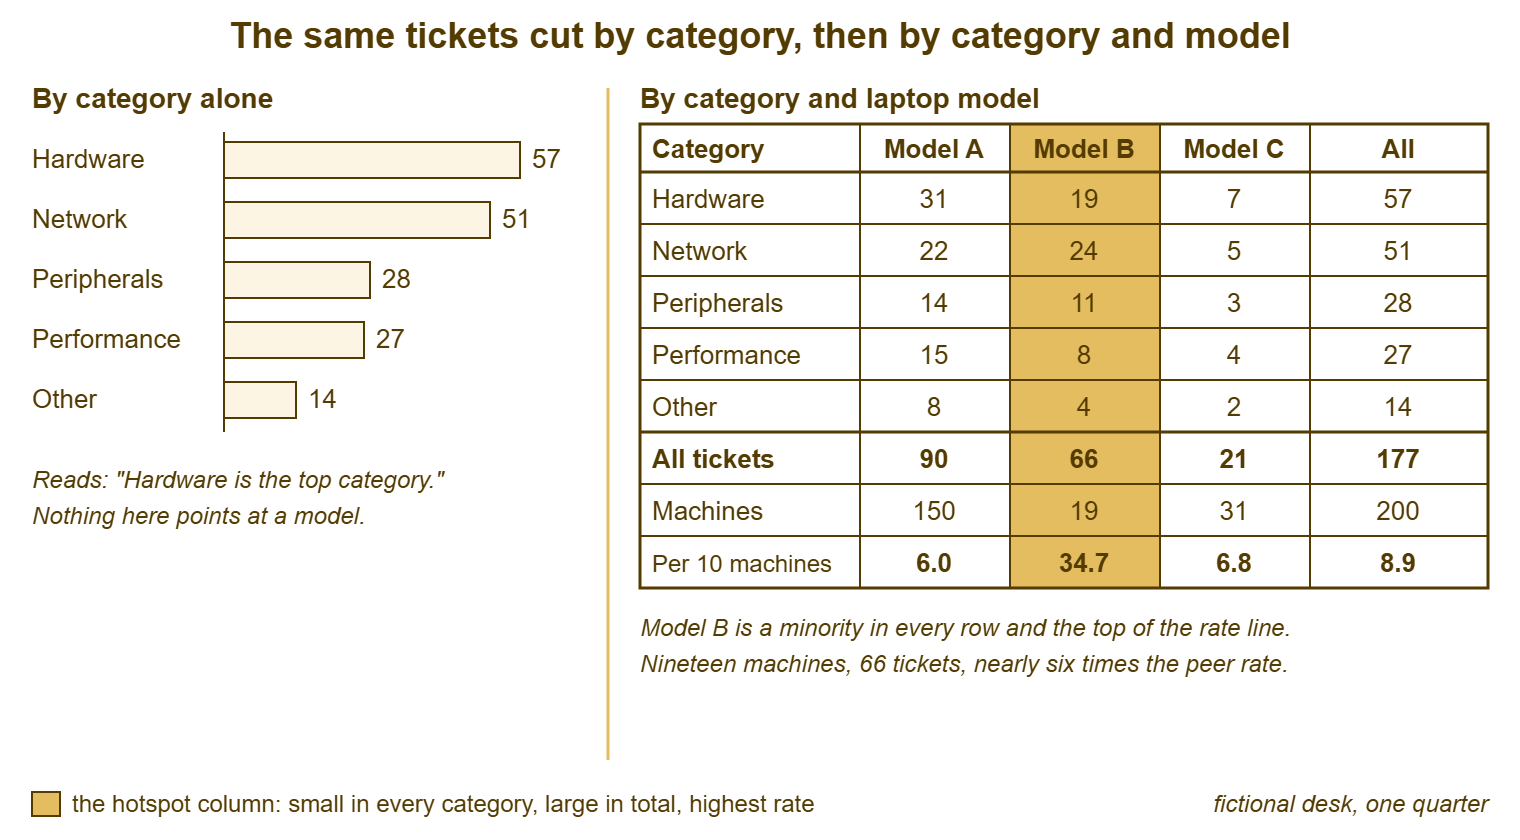
The picture below shows why, using the laptop tickets from this series' fictional desk at Meridian Parts. There, one model of nineteen machines was hiding inside five categories. On the left, the hundred and seventy-seven laptop tickets are counted by category alone: Hardware is the top category, and nothing points at a model. On the right, the same tickets are in a two-way pivot with categories down the side and the three laptop models across the top. Model B is a minority in every row, never more than half of any category. Its column total is sixty-six, from nineteen machines, against ninety from a hundred and fifty. The rate line underneath, tickets per ten machines, is where the cut turns into a finding: six, thirty-five, seven.
Make the one-way pivot for each of the four cuts first, and the two-way pivot only where a one-way result needs explaining. Category against device explains a hardware category; department against application explains a department. The two-way grid is not for browsing, because thirty sites by forty categories is twelve hundred cells and nobody reads twelve hundred cells. It answers one question about one line of a one-way list: this department is high, what is it high in? Pivot tables are the most useful thing in a spreadsheet and the fastest route to an afternoon that produces nothing. The difference is whether you had a question.
Reading the Top-Ten Lists
Sort each one-way pivot by count, largest first, and read the top ten. Four cuts give four lists. The lists are read for the same two things: how steep the top is, and whether the names at the top are things or just big. A list whose first line is three times its fifth is steep and has a candidate in it. A list that slopes gently from top to bottom has no hotspot in that cut, which is a result, not a failure. It is worth writing that result down so that nobody repeats the cut next week hoping for a different answer. Imani's site list was gentle apart from one shop. Her department list had Operations at the top because Operations is half the company. Her device list had two models above everything else. Her application list had the till software and the rota system well clear of the field.
The same source appears in several lists under different names, and part of reading the lists is noticing when it does. The Harbor Street store topped the site list, the deputy manager topped the requester list and the till software topped the application list. At Northgate, those turned out to be one thing seen three ways. The Harbor Street tills ran an older release. The deputy manager was the person who phoned about it, and the application cut named it. Three lines collapsed into one candidate. The lists are four views of one desk, and a hotspot that is real tends to show in more than one of them.
Write the candidates on one sheet as you go, one line each, with the cut that found them and the count. The sheet is short: a first hunt on a desk of Northgate's size produces between four and eight candidates worth a second look, not forty. If it runs to twenty lines, the labels are too fine (every machine instead of models, every error message instead of applications). In that case, they should be grouped up a level. If it has one line, they are too coarse ("laptop", "software") and should be split. The useful level is the one at which a candidate names something a person could be asked to replace, fix or change.
From Count to Rate: The Size Column
A count tells you which sources are big. A rate tells you which are hot, and the hunt is not finished until each candidate has one. The rate is the count divided by the size of the source. The size lives outside the ticket system. It is how many machines of that model the organisation owns or how many people use that application. Or it is how many people work at that site or in that department. Add a Size column to the candidate sheet and go and get the numbers. Get them from whoever buys equipment, from the application's owner, from the staff list. None of it is hard to find and all of it takes an hour of asking. That is why the hunt is an afternoon rather than a lunch break.
Divide, then compare like with like. Model B's rate is compared with the other laptop models, not with the printers. The Harbor Street store's rate, tickets per person who works there, is compared with the other twenty-nine shops. The expenses system's tickets per user is compared with the other business applications. A candidate whose rate is close to its peers is big and not hot, and comes off the sheet with a note. A candidate at two or three times its peers' rate, with a count that would be worth removing, stays. Northgate's Operations department came off the sheet at this step, with a rate just above the company's. The Harbor Street store stayed, at roughly four times the rate of the next-busiest shop. The two laptop models stayed, at several times the fleet rate.
Take known incidents out of the counts before you divide. That is because a single bad afternoon puts fifty tickets into one site or one application and makes it look hot for a quarter. The desk knows its incidents; the major ones are written up, and the minor ones are remembered. Subtract their tickets from the source they landed on, note the subtraction on the sheet, and read the rate from what remains. A source that is hot after its incidents are removed is a hotspot. A source that is only hot because of one incident is an incident, and it has already had its review.
Remember: the hunt is four cuts of a whole period's closed tickets, by location, group, device and application, each read as a top-ten list. A count makes a candidate, and only a rate against the source's peers, with known incidents removed, makes a hotspot.
The Traps That Make a Cut Lie
The first trap is the default value. A site field that defaults to Head Office, a department that defaults to General, a category that defaults to Other: every ticket whose requester was in a hurry carries the default. The default becomes the top of its cut. Before trusting any list, look at its top line and ask whether that value is one anybody chose. The cure during the hunt is to label the defaulted tickets by hand from their content or their requester. The cure afterwards is a form that makes the field required, or a requester record that fills it correctly. That is the user-facing work of Categorize at Close, Not Just at Open and its neighbours.
The second trap is the ticket that was never really a ticket. Examples are the merged duplicate, the reply that opened a new ticket by mistake, the test ticket, and the "as discussed" ticket raised for the record. Each is a row in the export and a count in the pivot. On a desk with a lively mail channel they can be a tenth of the rows. Filter them out before cutting, using whatever the export gives you: a merged status, a zero-minute resolution time, a subject beginning "Re:" from a technician. The ones you cannot identify are noise spread evenly across the cuts, which is tolerable. The ones concentrated in one source, such as a monitoring mailbox that opens a ticket per alert, are not. That source is cut separately or excluded with a note.
The third trap is the proxy requester. At Northgate, every ticket from the Fenbrook shop was raised by the store manager on behalf of nine staff, because that was the shop's habit. Every ticket from the Ashgrove shop was raised by whoever had the problem. The requester cut shows Fenbrook's manager as a heavy user and nothing about Ashgrove; the site cut shows both shops correctly. This is why the hunt treats the requester list as a signpost rather than a cut. A person at the top of it is a question to ask, not a hotspot to name.
The fourth trap is cutting by technician, and it deserves a sentence of its own because somebody will suggest it in every hunt. Tickets per technician measures who resolved what, not what produced it. The technician with the most laptop tickets is the one who is good at laptops. If the desk looks at per-technician numbers for any purpose, they are for coaching conversations and never for ranking. They should not be read at all from fewer than a few dozen tickets per person in the period. That is because below that one awkward week decides the number. The hotspot hunt does not need the column. Leave it out of the export and the suggestion goes away.
What to Do With the Candidates
Each candidate that survives the rate step gets a definition card, the one-page record described in the previous article. It has the count, the size, the rate, the symptoms and the categories the candidate hid in. The card takes ten minutes to fill in from the sheet. It turns the afternoon's work into something the desk can act on next quarter, when the spreadsheet is closed and nobody remembers what the pivot said. Three to six cards from a first hunt is usual. One is a quiet desk or a coarse cut. Ten is a desk that has been running without a hunt for a long time. In that case, the cards should be ranked by hours rather than all pursued at once.
Some candidates belong to a different process and should be handed to it rather than carded. A single machine with a dozen tickets is a lemon, not a hotspot. It goes on the lemon list in Tickets as Asset Intelligence, where the rule is replacement rather than analysis. One symptom repeating identically under many ticket numbers, with one probable cause, is a problem and gets a problem record. The hotspot card is for the source that produces several kinds of ticket, whose fix is to change the source rather than cure one symptom. The three overlap at the edges; a borderline case needs one home and a note, not an argument.
Book the next hunt before closing the spreadsheet, a quarter ahead. Save the export, the label list and the candidate sheet where the next person will find them. The second hunt is about half the work of the first, because the labels exist. And, if the desk acted on the findings, the form now fills in the device or application for most tickets. (Save the file. I have rebuilt a label list from memory twice, and memory is a poor spreadsheet.)
A Short War Story: The Head Office Wi-Fi at Redbrook Engineering
Redbrook Engineering's desk of three ran its first site cut and found Head Office at the top by a wide margin. Connectivity tickets were well above any other category. The desk lead, Priyanka, spent most of a quarter on a head-office wireless problem. The work included a floor survey, a contractor's day on site, new access points in two meeting rooms, and a report to the operations director explaining the spend. The tickets did not fall. In the second quarter's hunt, Ivo, the newest technician, read the top fifty head-office connectivity tickets rather than counting them. He found that thirty-one had been raised by e-mail from the Oakfield workshop. Its staff had no portal access. Its tickets therefore carried the site field's default value, which was Head Office. The workshop had a failing switch and had been saying so, in e-mails, for five months. The contractor's day and the two access points had been spent on a building without a problem. The switch was replaced in an afternoon. A cut is only as true as the field it counts. The first line of every list should be checked against the tickets before anyone acts on it.
The Hotspot Hunt Worksheet
The worksheet below is the afternoon in order, one page, with the four cuts as four short tables and the candidate sheet at the end. Section A is the export and the filtering. Do not skip the filter lines, because the duplicates and defaults you remove there are the difference between a list and a lie. Sections B to E are the cuts, cheapest first, with space for the top five rather than ten. That is because the sixth line of a steep list rarely matters. Section F turns candidates into rates and is where most of them fall off. Keep the finished worksheet with the export; the pair is the record the quarterly review reads.
HOTSPOT HUNT WORKSHEET — ONE PERIOD, ONE PAGE
Desk: ______________   Period: ____________ to ____________   Prepared by: ______________
Rows exported: ______   Rows after filtering: ______   Hours spent on the hunt: ______

A. EXPORT AND FILTER
   [ ] All closed tickets for the period exported, with subject and resolution note
   [ ] Merged duplicates, test tickets and auto-opened alert tickets removed: ______ rows
   [ ] Default values checked: site default ______  department default ______  category default ______
   [ ] Tickets carrying a default relabelled from content where possible: ______ rows
   [ ] Known incidents in the period listed (name, date, tickets): __________________________
   [ ] Device and Application columns added; label list saved as: ______________________

B. LOCATION CUT (site)            C. GROUP CUT (department / role)
   Site               Tickets        Department           Tickets
   1. ____________    ______         1. ____________      ______
   2. ____________    ______         2. ____________      ______
   3. ____________    ______         3. ____________      ______
   4. ____________    ______         4. ____________      ______
   5. ____________    ______         5. ____________      ______
   Shape: [ ] steep  [ ] gentle      Shape: [ ] steep  [ ] gentle

D. DEVICE CUT (model / batch)     E. APPLICATION CUT
   Model              Tickets        Application          Tickets
   1. ____________    ______         1. ____________      ______
   2. ____________    ______         2. ____________      ______
   3. ____________    ______         3. ____________      ______
   4. ____________    ______         4. ____________      ______
   5. ____________    ______         5. ____________      ______
   Shape: [ ] steep  [ ] gentle      Shape: [ ] steep  [ ] gentle
   Tickets with no device or application label: ______ (______ of the total)

F. CANDIDATES: FROM COUNT TO RATE
   Candidate        Cut   Tickets  minus incidents  Size (units)  Rate   Peer rate  Hot?
   ______________   ___   ______   ______           ______        _____  _____      [ ]
   ______________   ___   ______   ______           ______        _____  _____      [ ]
   ______________   ___   ______   ______           ______        _____  _____      [ ]
   ______________   ___   ______   ______           ______        _____  _____      [ ]
   ______________   ___   ______   ______           ______        _____  _____      [ ]
   ______________   ___   ______   ______           ______        _____  _____      [ ]

G. OUTCOMES
   Definition cards opened (hotspots): ______________________________________________
   Sent to the lemon list (single devices): __________________________________________
   Sent to problem management (one repeating symptom): ______________________________
   Form or field changes proposed so next quarter's column arrives filled: ___________
   Next hunt booked for: ____________   Export, label list and this sheet saved at: ______________
Imani and Theo finished the worksheet at a little after seven on the Thursday, with four cards. The cards were the two laptop models, the Harbor Street tills and the rota system. The rota system had been raising a steady stream of "can't see my shifts" tickets from every shop at a rate nobody had added up. Operations came off the sheet at section F. The deputy manager at Harbor Street, who had topped the requester list, turned out to have been right forty-one times in a row. The first thing Imani did on the Friday was tell her so.
Frequently Asked Questions
Our tool has reports by category and department. Is the export still necessary?
How many tickets do we need before the hunt means anything?
Most of our tickets have no device or application in them. What now?
Should the hunt be done on open tickets as well as closed ones?
Is a pivot table really necessary, or can I just sort and count?
A frequent requester tops the list. Should I speak to their manager?
From the QuerySolv team: we build self-hosted help desk software for Windows. QuerySolv runs as one Windows service on your own network. It takes requests by web form, e-mail, live chat, social messages and REST API. It is licensed once per installation rather than per agent per month. The free trial runs the full product for 30 days.