
Deflection Math Without Fooling Yourself or Your Manager
Monday, 08:50, at Meridian Parts. Three months ago Ben wrote the knowledge base article "Connecting to the VPN from home for the first time". Ben tested it on two people in sales, and published it on the portal with a link from the VPN error message. This morning Hana, who runs the desk, has the ticket report open. She is looking at a line she has been waiting to see. VPN connection tickets, which ran at about forty-six a month for the year before, have run at nineteen a month since. Twenty-seven tickets a month, gone. She has the sentence half typed into an e-mail to the operations director: "the VPN article is deflecting twenty-seven tickets a month". Then she stops, because she can hear him asking the only question that matters: how do you know it was the article?
Deflection is a ticket that never needed raising because the answer reached the person first. That could be through an article, a portal, a message on the error screen. What deflection is and is not, and the honest ways of counting it, belong to What Deflection Means and its series. This article takes the count and turns it into hours. Deflection math is one line of arithmetic: tickets avoided times the cost of one ticket, minus the effort of writing and keeping the article. The whole difficulty is that every term in it can be made larger without anyone lying. This article is part of our Measuring Self-Service ROI series. It is about doing that one line in a way you could defend to a sceptic. Every number is a worked example from a fictional desk.
It covers the formula on one line; building the baseline; the five counting rules; why there are always two columns, low and high. Next come the worked example of one article, drawn as a ledger, and subtracting the effort. Then it covers going from one article to the whole knowledge base without double counting and what the reported sentence sounds like. A short war story and the deflection calculation sheet to copy follow, in that order.
The Formula on One Line
Net hours freed per month equals avoided tickets per month, times hours per ticket of that type, minus upkeep hours per month. The one-off writing effort is paid back out of the first months. That is the entire mechanism. It has four terms, and this series has already dealt with one of them. Hours per ticket, as two figures that must never be mixed, is the subject of What ROI Means for a Help Desk. The hands-on figure for the ticket type is the low estimate of what an avoided ticket saves. The loaded figure for the desk is the high estimate. Everything in this article is about the other three terms, and mostly about the first, because "avoided tickets" is where the fooling happens.
The formula is per article, or per cluster of articles about one ticket type, never for the knowledge base as a whole in one go. A knowledge base does not deflect tickets. An article about the VPN deflects VPN tickets. An article about shared mailboxes deflects shared-mailbox tickets. And an article about the history of the desk's naming conventions deflects nothing and was written for the author. When the sum is done per article and added up at the end, the articles that carry the result are visible. The ones that carry nothing are visible too. When it is done for the whole knowledge base at once, the second group hides behind the first. That is comfortable and is also the reason the sum stops being believed.
Hours are the units throughout. A manager who wants currency can multiply the final line by a rate. The desk's job ends at hours because hours are what the desk can prove from its own tickets. The formula produces a range, not a point, because two of its terms are themselves ranges. If a single number is demanded, give the middle of the range and say so. (The spreadsheet will give you a point to nine decimal places. It is not being helpful.)
Building the Baseline
The baseline is how many tickets of the type arrived per month before the article existed. The baseline period must be an ordinary period of at least three months. One month is an anecdote. Two months is two anecdotes. Three is the smallest number from which you can see whether the figure wobbles. The wobble is part of the result. Meridian's VPN tickets ran at forty-four, forty-nine and forty-five in the three months before Ben's article. Hana recorded that as "forty-six, give or take three". The take matters; a baseline quoted as a single figure makes every later comparison look sharper than it is.
Ordinary means nothing unusual was happening to that ticket type. Check the three months for anything that would have inflated or suppressed the count. Look for an outage of the thing the article is about, a rollout, or a merger. Look for a change to how tickets of that type were labelled or a long holiday period. If the before-period includes a week when the VPN gateway was down and sixty people raised a ticket, those sixty are an incident, not baseline. Leaving them in makes the article look like it fixed an outage. Push the window back to three ordinary months, or take the incident out and say so. The honest baseline is the dull one, and finding it is most of the work.
Define the ticket type the same way before and after, from the ticket content, not from the label alone. Labels drift. A desk that starts an article programme often tidies its ticket types in the same quarter. A type that was called "Remote access" before and "VPN" after will show a drop that is entirely administrative. The safest method is to read the tickets. Forty-six a month is not many. Hana read all three months of them in an hour, with a tally of what each one was actually about. That tally became the baseline, independent of what anyone had typed into a drop-down. Count what the tickets say, not what they were filed under.
The Five Counting Rules
The first rule is that only a drop in the ticket type the article covers counts, measured against the baseline for that type. If VPN tickets fell by twenty-seven and printer tickets also fell by four, the four are not the VPN article's. This sounds too simple to need saying. Then you watch a desk credit a knowledge base with a drop in total volume. Yet a third of the drop was in types the knowledge base never mentioned. Deflection is specific: the article answered a question, and only tickets asking that question can have been avoided.
The second rule is to check what else changed. Tickets of a type fall for reasons other than articles. The thing got fixed or replaced. The people who used the thing left, or the season changed. A reorganisation moved a department onto a different system. Before any drop is credited to an article, write down everything that happened to that ticket type in the after-period. Decide, honestly, how much of the drop belongs to each. Where you cannot tell, the uncertainty goes into the range, which is what the range is for. A drop in tickets will accept credit from anyone who offers it. Make it earn it.
The third rule is to use a control type. That is a ticket type you did not write about, of similar size, watched over the same months. If the control type fell by a tenth, the desk was a tenth quieter for reasons of its own. In that case, the same tenth comes off the VPN drop before the article gets the rest. If the control type held steady or rose, the whole drop is plausibly the article's. Meridian's control was printer tickets, which ran at twenty-six before and twenty-five after. That difference was within the wobble, so Hana took no drift off. The control is the cheapest honesty check available, and almost nobody uses it, because it means looking at a ticket type you were not interested in.
The fourth rule is that article views are never tickets. A view is a page opened. Some viewers would have raised a ticket, some were checking, some were technicians, and some were the same person four times. The relationship is real and it is the subject of Measuring What Got Deflected, where the honest methods live. But views feed the low estimate only indirectly, through the signals that come with them. The most useful of those is the "this solved it" response, where the portal offers one. A reader who says the article answered the question is an avoided ticket you can point at. Ben's article collected those at about fifteen a month over the three months. That is the floor.
The fifth rule is the one this article exists for: carry two counts forward, a low and a high, and never collapse them. The low count is the number of avoided tickets you can tie to the article. You can do that through "this solved it" responses. Where there is no such button, use the drop in the exact question the article answers, after the control drift is taken off. The high count is the whole drop in the ticket type, after the control drift, on the assumption that the article caused all of it. At Meridian the low count was fifteen and the high was twenty-seven. The truth is somewhere between, and the honest report says so, in those words.
| Something else that could explain the drop | How to check | What to do with the sum |
|---|---|---|
| The thing was fixed or replaced in the after-period | Ask the people who run it; look for a change record in the same months | Credit the drop to the fix, not the article; the article may still save technician time |
| Fewer people use the thing now (leavers, a department moved) | Compare headcount or active users before and after | Scale the baseline down in proportion before measuring the drop |
| Season or holiday period | Compare with the same months a year earlier, if the records go back; otherwise watch the control type | Widen the range, or wait for an ordinary quarter |
| Ticket type relabelled or re-filed | Read a sample of after-period tickets in neighbouring types for the same question | Rebuild both counts from ticket content, not labels |
| The whole desk got quieter | The control type fell too | Take the control type's percentage fall off the drop before crediting the article |
| People stopped raising tickets and started phoning a technician | Ask the technicians; look for "as discussed" tickets and a quiet department | Not deflection; the tickets moved into a shadow channel and should be logged |
Two Columns, Always
The sum is done twice, side by side, and the two columns differ in exactly two places. Those are the count of avoided tickets, low or high as above, and the hours per ticket, hands-on or loaded. The low column multiplies the low count by the hands-on figure for the type. It is the saving you could defend under oath: these readers said the article answered them. And this is the time a technician spends on one such ticket. The high column multiplies the whole drop by the loaded figure. It is the saving if every avoided ticket took its full share of the desk's overhead with it. Some share of them did. Report both. The reader will pick a point between them, which is their job. It will be a kinder point than the one they would have picked from a single inflated figure. That is because they will believe the range.
Never cross the columns. The commonest deflection figure in circulation is the high count at the loaded rate, presented alone. And it is several times the low figure for a quick ticket type. The second commonest is the low count at the hands-on rate. It is presented alone by a desk that has been burned before and now undersells everything. That is honest and loses arguments it should win. The two-column ledger is the way out of both. And it costs one extra column in the spreadsheet with the same formulas and different inputs.
Remember: an avoided ticket is a drop in the ticket type the article covers, against a three-month baseline, after the control type's drift is removed. Carry a low count and a high count. Multiply by the hands-on and loaded figures respectively. Subtract the effort from both, and report the range.
The Worked Example: One Article, as a Ledger
Here is Ben's VPN article done in full at Meridian Parts, the fictional desk this series uses for its arithmetic. The picture below is the same sum drawn as a nine-line ledger. The baseline was forty-six VPN tickets a month over three ordinary months. The after-period was nineteen a month over three more; the drop was twenty-seven. The control type did not move. The "this solved it" responses on the article averaged fifteen a month, so the low count is fifteen and the high is twenty-seven. The hands-on figure for a VPN ticket, from a sample of twenty, was about half an hour; the desk's loaded figure was about 1.2 hours. Low column: fifteen times a half, seven and a half hours a month. High column: twenty-seven times 1.2, about thirty-two hours a month.
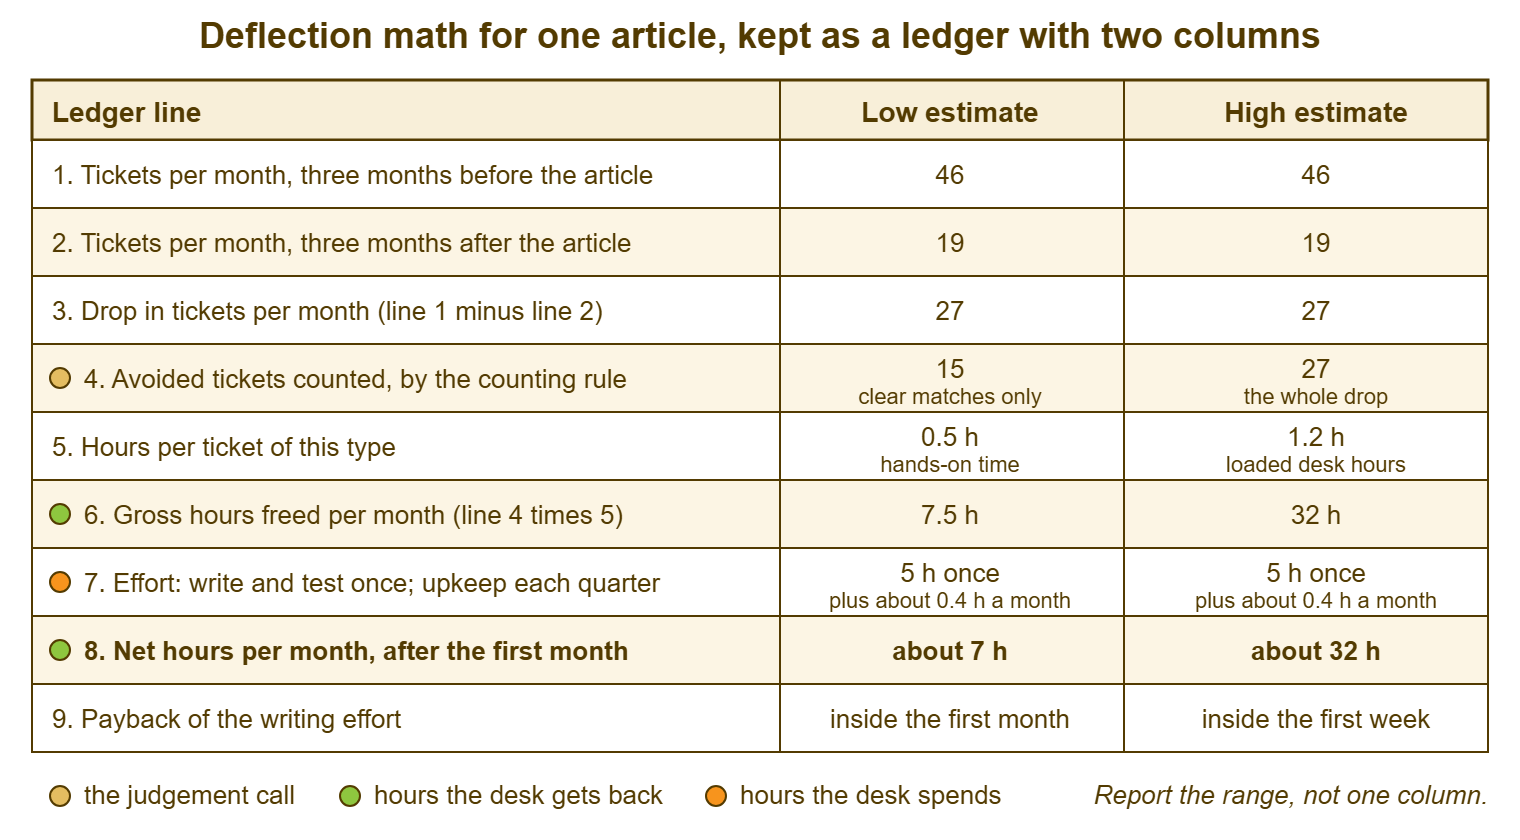
Read the ledger from the top and notice where the judgement lives. Lines one to three are counting, and anyone with the ticket list gets the same numbers. Line four is the only decision: which avoided tickets to count. It is the line that produces two columns instead of one. Line five is the previous article's work. Lines six to nine are arithmetic. A sceptic reading this ledger can disagree with exactly one line, and that line is marked. The argument, if there is one, is about fifteen versus twenty-seven. Both are defensible numbers rather than a guess and a hope.
The result for one afternoon's article is between roughly seven and thirty-two hours a month, net, after the first month. Over a year that is somewhere between eighty and three hundred and eighty hours. That is between two working weeks and most of a quarter of one technician. All that comes from a document that took five hours to produce. Even the low end is a return nobody would turn down. That is the ordinary shape of a well-chosen article's deflection sum. And it is why the choosing matters more than the writing. An equally good article about a ticket type that arrives twice a month would have produced a ledger with a net of about an hour.
Subtracting the Effort
The effort is every technician hour that went into the article and every hour that will go into keeping it true. And it is subtracted in two parts because it arrives in two shapes. The one-off part is the writing, the testing on real users, the review by whoever approves articles, the screenshots, the link placed on the error page. For Ben's article that was three hours writing, an hour testing with two people in sales, and an hour of Hana's review: five hours, once. The recurring part is upkeep: the quarterly check that the steps still match the screens, the rewrite when the client changes its menus. Meridian budgeted an hour a quarter, which is a third of an hour a month. In the first year it came out at about that.
Pay the one-off part back out of the first months rather than spreading it thinly over years. That is how a manager will think about it. It also gives you a payback line. That is the most persuasive sentence in the whole sum. Five hours of effort against seven and a half hours a month of low-column saving pays back in about three weeks. Against thirty-two hours a month the effort pays back in the first week. "The article paid for itself inside the first month even on the cautious count" is a sentence that ends arguments. Subtract the recurring part from every month after that. That is the difference between the gross line and the net line on the ledger. It is small for a good article and not small for a bad one.
Count the effort honestly even when it is embarrassing, because the embarrassing cases are the ones the next article in this series needs. Suppose an article took twelve hours because it was rewritten three times, and deflects four tickets a month at ten minutes each. It has a net of about forty minutes a month and a payback of a year and a half. That is useful to know, because it tells you which articles to stop maintaining, the subject of the last article in this series. You can only know it if the effort was written down when it was spent, not estimated fondly a year later. Write the hours in the article's own record on the day.
From One Article to the Whole Knowledge Base
Add the articles up at the end, one ledger each, and let the ones with nothing on them show as nothing. At Meridian the knowledge base had about a hundred and forty articles after a year. When Hana ran the ledger on all of them, eleven had a measurable drop in a ticket type. Thirty or so were runbooks that saved technician time but deflected nothing because the user never saw them. The rest had no drop that survived the counting rules. The eleven carried the whole deflection result. That is normal, not a failure of the other hundred and twenty-nine, most of which were never meant to deflect. It is a reason to report the eleven by name and say plainly what the others are for.
Watch for double counting, which happens when two articles address the same ticket type. If "Connecting to the VPN for the first time" and "VPN says certificate error" both exist, and VPN tickets fell by twenty-seven, the twenty-seven is shared between them, not claimed by each. The rule is that a ticket type's drop is counted once, however many articles cover it. Divide it between them by the "this solved it" responses if you have them, or simply report the cluster as one line. A knowledge base in which every article claims the whole drop in its type can show more avoided tickets than the desk ever received. I have seen a summary that did. Nobody had cheated. Everybody had been thorough.
Keep the deflection sum separate from the technician-time sum, because they are different hours and the second is usually larger. Deflection counts tickets that stopped arriving. Technician time counts the tickets that still arrive and take less to resolve because the runbook is open. That is where the thirty runbooks earn their keep. The technician-time sum has its own method and its own article, The Time Saved by Technicians. Add the two totals on the one page you eventually show to management, as two lines with their own ranges, never as one blended figure. Where the knowledge base lets you mark an article as visible to everyone or to the desk alone, as QuerySolv and most tools do, the split is already made for you. Public articles go in the deflection sum and internal ones in the technician-time sum.
What the Reported Sentence Sounds Like
The report of one article is one sentence with a range, a method and a payback: "The VPN article is avoiding between fifteen and twenty-seven tickets a month, measured against a three-month baseline with printer tickets as the control, which is between seven and thirty-two technician hours a month net of upkeep; it paid back its five hours of writing inside the first month on the cautious count." Every number in it can be traced to a line on the ledger. There is no adjective in it. It is longer than "the VPN article is deflecting twenty-seven tickets a month" and it is the one Hana sent. That is because it survives the operations director's question. And the director, like most people who approve budgets, had heard the short version from vendors before and had learned to halve it.
The report of the whole knowledge base is the same sentence for each of the articles that carry a result. It includes a total of the ranges and one honest line about the rest. That line reads: "eleven articles account for the deflection; thirty are runbooks counted under technician time; the remaining articles show no measurable deflection and are kept for reference or scheduled for review". A manager reading that knows what the knowledge base is doing, which parts of it are doing it, and that the desk knows the difference. That last thing is worth more than any figure in the report, and it is the thing an inflated figure throws away. For a programme whose whole result is one ticket type, such as self-service password reset, the same ledger applies. The specific before-and-after method is in Measuring the Drop.
When the low column is negative, say so. An article whose upkeep costs more than its cautious saving is a real finding. And a desk that reports "two articles cost more than they save and we are retiring them" has just demonstrated that its positive numbers are honest too. The ledger is not a scoreboard. It is a tool for deciding what to do next, and some of what to do next is stop.
A Short War Story: The Borrowed Drop at Northgate Retail
At Northgate Retail, a desk lead called Kofi published an article on fixing the till scanner's "device not found" error in June. Kofi watched the scanner tickets fall from about sixty a month to under thirty by August. Kofi reported a deflection of thirty tickets a month at the loaded rate, in a summary. That summary was forwarded upward twice and quoted in a budget paper. In September the tickets came back. The drop had been the till supplier's summer software update, which had fixed the fault that caused most of the tickets. The September update had brought the fault back. The article had been read a few dozen times in all and answered, at best, a handful of them. The regional operations manager, who had quoted the figure, asked Kofi why the article had "stopped working". Kofi spent most of a week rewriting an article that had never been the cause of anything. That was followed by an awkward meeting in which the budget paper was corrected. The desk's later figures, built properly with a control type and a check of what else had changed, were accurate and were nonetheless asked for twice. A drop that is not checked against what else changed in the same months is not deflection; it is coincidence with a byline.
The Deflection Calculation Sheet
The sheet below is the ledger as a form, one copy per article or per cluster of articles about one ticket type. Sections A and B are counting, from the ticket list, and should take under an hour for any ticket type a desk would bother writing about. Section C is the one judgement, and it is where the two columns begin. Sections D and E are arithmetic and the effort. Section F is the checklist that stops the result lying, and the result does not leave the desk until every box is ticked. Keep the completed sheets. The next one you fill in for the same article, a quarter later, is the trend. And the trend is what the one-page summary for management is built from.
DEFLECTION CALCULATION — ONE ARTICLE, ONE PAGE
Article: ______________________________   Ticket type it answers: ______________________
Published on: ____________   Sheet prepared by: ______________   Date: ____________

A. BASELINE (three ordinary months before publication)
   A1 Tickets of this type, month 1 / 2 / 3 ...................... ____ / ____ / ____
   A2 Monthly baseline (middle value) and wobble ................. ____  give or take ____
   A3 Anything unusual in these months (incidents, rollouts) ...... ______________________

B. AFTER (three months after publication, skipping the launch month)
   B1 Tickets of this type, month 1 / 2 / 3 ...................... ____ / ____ / ____
   B2 Monthly figure after (middle value) ........................ ____
   B3 Raw drop per month (A2 minus B2) ........................... ____
   B4 Control type: ______________  before ____  after ____  change ____ percent
   B5 Drop after control drift removed ........................... ____
   B6 What else changed for this ticket type in the after-period . ______________________

C. THE COUNTING RULE (the one judgement)
   C1 LOW count: avoided tickets you can tie to the article
      ("this solved it" responses per month, or the drop in the
      exact question the article answers) ........................ ____
   C2 HIGH count: the whole drop after control drift (B5) ........ ____

D. HOURS                                                        LOW        HIGH
   D1 Avoided tickets per month (C1 / C2) ..................... ____       ____
   D2 Hours per ticket (hands-on for the type / loaded) ....... ____       ____
   D3 Gross hours freed per month (D1 times D2) ............... ____       ____

E. EFFORT
   E1 One-off: writing ____ h  testing ____ h  review ____ h  total ____ h
   E2 Upkeep per quarter ____ h, so per month ................. ____
   E3 Net hours per month (D3 minus E2) ....................... ____       ____
   E4 Payback of E1 at the LOW net rate ....................... ____ weeks
   E5 Net hours per year (E3 times 12, both columns) .......... ____ to ____

F. BEFORE THIS LEAVES THE DESK
   [ ] Baseline is three ordinary months, and oddities are listed in A3
   [ ] Ticket type counted from ticket content, the same way before and after
   [ ] Control type checked and drift removed
   [ ] B6 is filled in, even if it says "nothing"
   [ ] No article view has been counted as a ticket
   [ ] Both columns present; the range is what gets reported
   [ ] This ticket type's drop is not also claimed by another sheet
   [ ] Effort hours were recorded when spent, not estimated later
Hana filled in the sheet for the VPN article that Monday morning. It took forty minutes because the baseline tally already existed. The e-mail she sent was the long sentence above rather than the short one. The operations director wrote back asking what the control type was, which pleased her more than it should have. Twenty-seven was never claimed. Fifteen to twenty-seven was, and it was never once questioned.
Frequently Asked Questions
Our portal has no "this solved it" button. How do I get a low count?
How long after publishing should I wait before measuring?
What if we changed several things at once: an article, a form change and a fix?
Should I subtract the time technicians spent reading the article?
Which control type should I pick?
Is a deflection rate, as a percentage, ever the right thing to report?
From the QuerySolv team: we build self-hosted help desk software for Windows. QuerySolv runs as one Windows service on your own network. It takes requests by web form, e-mail, live chat, social messages and REST API. It is licensed once per installation rather than per agent per month. The free trial runs the full product for 30 days.