
Where the Money Actually Goes: The Cost Map of a Support Desk
Tuesday, 16:20, at Redbrook Engineering. Priya runs the four-person support desk, and the finance business partner, Owen, has stopped by her desk with a notebook. "I'm doing the departmental cost review. What does support cost us?" Priya gives him the only answer she has: four salaries and the annual licence for the ticket system. Owen writes it down, thanks her, and leaves. On her way to the kitchen she passes Dev, who is being asked at the printer whether he can "just quickly" look at someone's laptop. She passes Sam, who is typing a request that arrived by phone into the ticket system from a sticky note. She also passes her own screen, where two tickets closed last week have come back reopened. None of that is in Owen's notebook. All of it is a cost, and the organisation is paying it whether or not anyone writes it down.
A cost map is a one-page account of every hour the organisation spends because support exists, or because support fell short, grouped by where the hour went. It has more lines than the budget. The budget shows what the desk is paid and the map shows what the desk, and everyone who depends on it, actually spends. This article is part of our The Economics of Support series. The series adds up the cost of a desk honestly, in hours. Every number is a worked example from a fictional desk rather than a statistic from anywhere.
It starts with why the budget line is not the cost. Then come the five places the hours go: handling, rework, walk-ups, tool and admin overhead, and waiting. Next are how to draw the map for your own desk in an afternoon, and what the finished map tells you to do first. A short war story and the cost map template to copy finish the article.
The Budget Line Is Not the Cost
The budget shows what the desk is paid, and the cost is what the organisation spends, and the two are different numbers. Four salaries and a licence buy about six hundred working hours a month at Redbrook. Those six hundred hours are real, but they are only the part of the cost that arrives as an invoice. The rest arrives as a technician's afternoon spent on tickets that were already fixed once. Or a sales manager's morning spent without a working laptop. Or a request typed out three times by three people. Nobody invoices for those. They are paid in hours, by whoever happened to be standing nearest.
Hours are the only honest currency for this map, and money is somebody else's arithmetic. An hour is a thing the desk can count from its own records and defend from its own tickets. A currency figure depends on a rate that finance owns. The moment the desk quotes one, the conversation becomes about the rate. The case for hours, and the two cost-per-ticket figures that come from them, is made properly in What ROI Means for a Help Desk. This article leans on it rather than repeating it. Draw the map in hours. Let Owen multiply.
The reason to draw the map is that a desk which only knows its budget line argues against itself. When the only visible cost of support is four salaries, every proposal to improve support looks like a proposal to spend more on four salaries. Then the only way to spend less is to have fewer. When the map is visible, most of the cost turns out to be somewhere other than the salaries, and most of it turns out to be shrinkable without touching them. The map is not a defence of the desk. It is a description of where the money went, and the desk is usually the smallest place it went.
Handling Hours: The Part Everyone Counts
Handling hours are the technician time spent on tickets that arrived properly and were resolved properly: the triage, the diagnosis, the fix, the reply, the chase when the requester went quiet. This is the line people mean when they say "the desk's time". It is the most measurable line on the map because the ticket system holds a record of all of it. At Redbrook, four technicians handled about four hundred and twenty tickets in an ordinary month. From a sample of timestamps Priya put the handling hours at about three hundred and ten. That figure is the desk's honest workload and nothing to apologise for.
Measure handling hours from the tickets, not from the feeling. Pull the resolved tickets for one ordinary month. Take a sample of twenty from each of the five or six biggest ticket types. Read the timestamps from first touch to resolution with the waiting stretches taken out. Multiply the middle value for each type by the number of tickets of that type. Add a share for triage, which is the few minutes every ticket costs before anyone starts working on it. The method is the hands-on figure from the ROI article above, applied to the whole month rather than one type. It took Priya an afternoon, which is the standard cost of finding out something true about a desk.
Rework: Paying for the Same Ticket Twice
Rework is technician time spent on a ticket, or a problem, that the desk had already spent time on. A resolved ticket the requester reopened because the fix did not hold. The same fault raised again by the next person to hit it. A ticket handed between two technicians and worked from the start by each. Every hour of rework is an hour that was already paid for once. It is the most expensive line on the map per hour, because the first attempt cost handling hours and taught nobody anything. The second attempt costs handling hours again plus the goodwill of a requester who thought they were done.
Rework hides inside handling hours unless you pull it out, and pulling it out is a matter of three filters. Reopened tickets: every ticket resolved and then reopened in the month, with the hours spent after the reopen. Repeat tickets: every ticket whose fault matches one resolved in the previous quarter, which takes a half-hour read of the month's titles and a willingness to notice. Bounced handoffs: every ticket reassigned more than once, with the time the second and third technicians spent re-reading what the first one knew. In QuerySolv, the complete event history on each ticket records every reopen and every reassignment. So the first and third filters are a matter of reading rather than reconstruction. In any tool, the reopen count and the reassignment count are the two figures to find.
At Redbrook the rework line came to about fifty-five hours a month, and Priya had guessed fifteen. Thirty tickets had been reopened, at about an hour each after the reopen. Twenty or so were repeats of faults the desk had already fixed for someone else. Usually it was a shared drive or a printer that had been fixed per person rather than per cause. The rest were handoffs where the second technician had started from the title. Fifty-five hours is most of two weeks of one person, and it is spent entirely on things the desk already knew how to do. The rework line, when it is first drawn, is where desk leads go quiet for a moment.
What a reopen means, and how to count one honestly, belongs to What a Reopen Is Telling You; the map only needs the hours. Note the three sources separately, because they have three different fixes: a reopen is a quality problem, a repeat is a problem-management problem, and a bounce is a handoff problem. One figure called "rework" is enough for the map and useless for the plan.
Walk-Ups and the Shadow Channel
A walk-up is a request that arrives in person, by phone, or by a direct message to a technician, is handled on the spot, and never becomes a ticket. It costs exactly what a ticket costs, usually more, because it arrives mid-task and the task it interrupted has to be picked up again afterwards. It appears nowhere in the ticket system, so it appears nowhere in the handling hours. A desk that measures itself from its tickets alone will report a workload that is smaller than the one it carries. The shortfall is the walk-up line, and on most maps I have drawn it was the line that made the desk lead sit up.
Walk-ups are counted with a tally sheet, because that is the only instrument that works. Each technician keeps a sheet for one ordinary week and makes a mark for every interruption that did not become a ticket, with a rough duration. Dev's sheet at Redbrook showed fourteen walk-ups and nine phone calls in a week, averaging about ten minutes each including the time to find his place again. Across four technicians and a month that came to about sixty hours. Sixty hours a month, invisible, is a tenth of the desk. Nobody had asked for it; it had been donated, ten minutes at a time, to whoever was nearest.
The fix for the walk-up line is to log them, and the fix for logging them is to make it cheap. A technician who has to fill in a six-field form after every corridor conversation will not. A technician who can raise a two-line ticket in twenty seconds, with the requester's name and what was done, will, most of the time. If you run QuerySolv, a walk-up logged after the fact is an ordinary ticket in the same queue as the ones that came by e-mail or the web form. In that case, once the habit takes, the walk-up line on the map comes from the ticket list rather than a tally sheet. The untracked walk-up has a cousin: the shadow channel where a department stops raising tickets and starts phoning a favourite. Both are quiet failures in The Seven Ways Support Quietly Fails. The map is the first place their cost becomes a number.
Tool and Admin Overhead
Tool and admin overhead is technician time spent feeding the machinery of support rather than supporting anyone. Re-keying a phone request into the ticket system. Copying the same details into a second spreadsheet. Hunting for the history of a device across three places. The weekly meeting that goes through the queue line by line. The status update typed for a manager who could have read the ticket. Every desk has some. The question is how much, and the answer is found the same way as the walk-ups: a tally sheet, one week, every technician, every task that was about the ticket rather than the problem.
At Redbrook the overhead came to about forty-five hours a month, in four pieces. Re-keying phone requests, about seventy a month at six minutes each, was seven hours. The Monday ticket meeting, an hour for four people every week, was seventeen. Hunting for the history of a thing, a device, a user, a previous fix, was about ten minutes on one ticket in four, which is seventeen more. Updating the asset spreadsheet by hand after any ticket that moved a device was the rest. Forty-five hours is not scandalous; it is the ordinary friction of a desk that has grown habits faster than it has reviewed them. It is also forty-five hours, every month, which is more than a week of one person spent on typing things that were already typed.
Overhead is the line most likely to be caused by the tool rather than the people, and it is the line that the choice of tool most affects. A ticket system that takes requests from every channel into one queue removes the re-keying. One that keeps a device's history on the ticket removes the hunting. One that shows the queue plainly removes the meeting about the queue. The habits themselves, and how to price each one, have their own article in this series, The Cost of a Bad Tool or a Bad Process. For the map, one figure will do, with the four biggest pieces named underneath it, because the pieces are the plan.
Waiting: The Hours That Belong to Everyone Else
Waiting hours are the time requesters lose while their ticket is open. The sales manager who cannot send a quote until the laptop works. The new starter who sits for two days without an account. The warehouse that keys stock by hand because the scanner is in a queue. These hours are not the desk's hours and must never be added to them. The desk cannot spend them, save them, or defend them from its own records the way it can defend a technician's afternoon. They are, however, the biggest line on the map at every desk I have ever mapped, usually by a distance. Leaving them off is how a cost map ends up describing a tenth of the cost.
The honest way to estimate waiting hours is a separate piece of work with its own rules. It has its own article in this series, The Cost of Waiting, which this one points to rather than repeats. For the map, the short version is enough. For a sample of tickets, decide whether the requester was fully blocked, partly blocked, or merely waiting. Estimate the blocked hours for each, and scale up to the month as a range. Redbrook's first estimate came out between five hundred and a thousand requester hours a month. The width of that range is honest. Both ends of it are larger than the desk's entire handling line.
Report waiting hours on their own line with their own label and let the reader value them. "Requesters spent somewhere between five hundred and a thousand hours last month waiting for tickets to be resolved" is a sentence Owen can take back to finance and do what he likes with. "Support cost the business sixteen hundred hours last month" is the same figure with the desk's hours added in. It is both wrong and the kind of wrong that costs a desk its credibility the first time somebody asks how it was built. Keep the lines apart. The map has room.
Remember: the cost map is the desk's own hours split into handling, rework, walk-ups and overhead. The requester's waiting hours go on a separate line that is never added to the desk's. Every figure comes from tickets or a tally sheet, is quoted as a range, and is for one ordinary month.
Drawing the Map in Hours
Here is Redbrook's map for one ordinary month, built from the figures above, and the picture below is the same map drawn as three bars to one scale. The desk had six hundred working hours after leave. Three hundred and ten went on handling tickets. Fifty-five went on rework. Sixty went on walk-ups that never became tickets. Forty-five went on tool and admin overhead. The remaining hundred and thirty were not support at all: the file server move, patching, two training days and the usual administration. These belong on the map so that nobody later asks where they went. Underneath the desk's six hundred, on its own bar, requesters spent somewhere between five hundred and a thousand hours waiting.
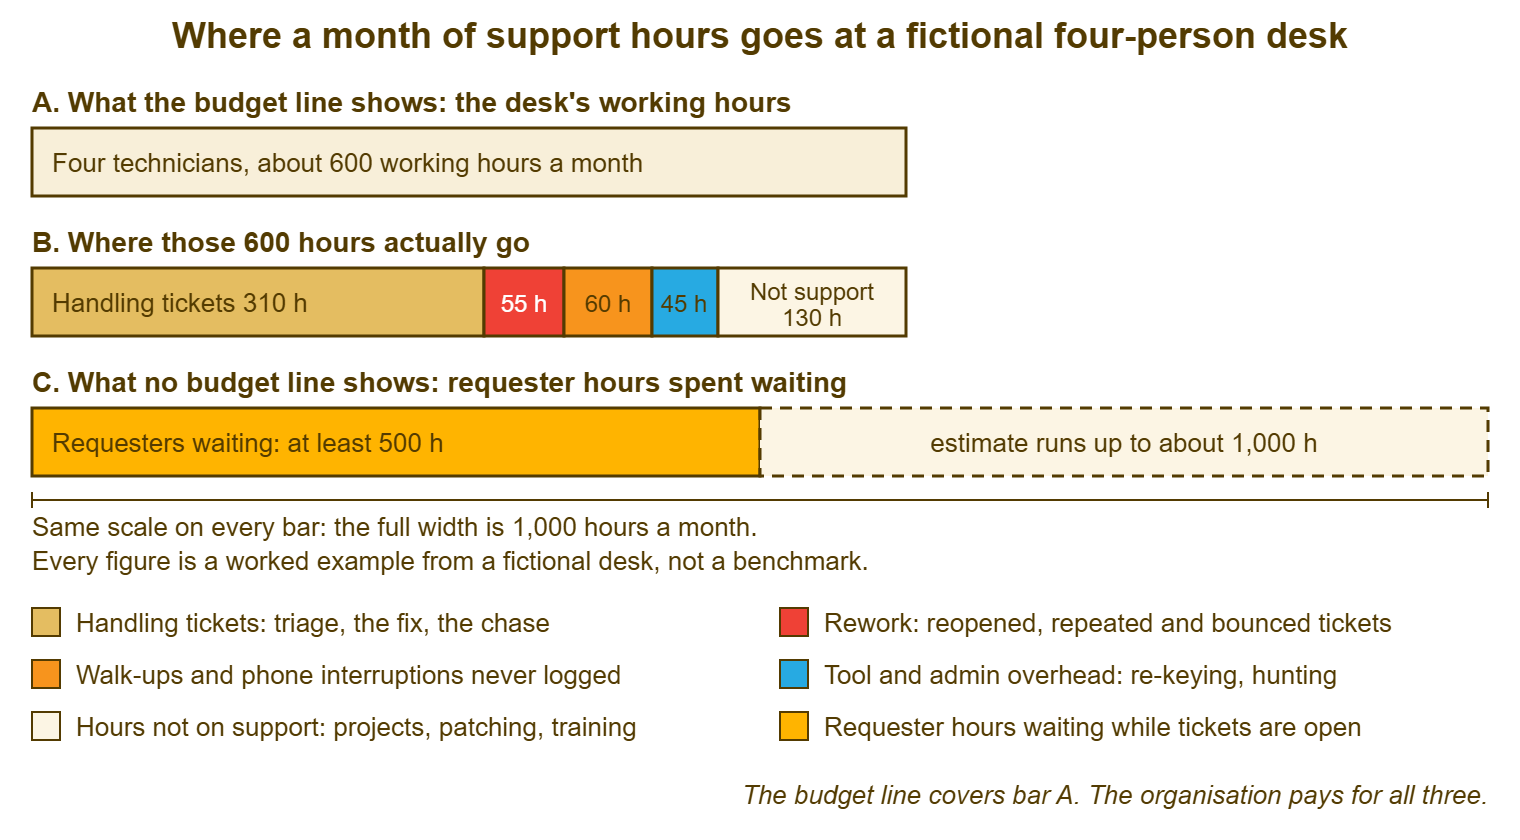
Read the picture from the top and notice what each bar is for. Bar A is what Owen wrote in his notebook, and it is correct as far as it goes. Bar B is the same six hundred hours with the waste made visible. A hundred and sixty of them, the red, orange and blue segments together, are rework, walk-ups and overhead. That is more than a quarter of the desk spent on things that were not the work. Bar C is the line that was never in any notebook, and it is longer than the desk's whole month at the cautious end of the range. The scale is the same on every bar. That is the only trick in the picture, and it is the whole argument.
The table below is the same month as a list, with where each figure came from, because a map without sources is a drawing. Every line can be traced to tickets, to a sample of timestamps, or to a sheet that four named people kept for a named week. A reader who doubts a figure can be told exactly how to doubt it better.
| Line on the map | Hours in the month (fictional desk) | Where the figure came from |
|---|---|---|
| Working hours available | about 600 | Four technicians' contracted hours, minus leave on the calendar |
| Handling tickets | about 310 | Twenty-ticket timestamp samples for the six biggest types, times the month's count, plus a triage share |
| Rework | 50 to 60 | Reopened tickets, repeat faults from a read of the month's titles, and tickets reassigned more than once |
| Walk-ups and calls never logged | 55 to 70 | One week of tally sheets from all four technicians, scaled to the month |
| Tool and admin overhead | 40 to 50 | The same tally sheets, marking re-keying, hunting, the queue meeting and the asset spreadsheet |
| Not support (projects, patching, training) | about 130 | Calendars and the project log; the remainder after the lines above |
| Requester hours waiting (separate line) | 500 to 1,000 | A sample of forty tickets classified as blocked, partly blocked or merely waiting, scaled to the month |
Draw it for one ordinary month, and write down what made the month ordinary. A month with a migration in it will show a handling line that is not typical. A month with two people on leave will show an overhead line that is not typical either, because the Monday meeting still happens with two chairs empty. If the first month you have clean figures for is odd, say so on the map and draw a second month when you can. The honest map is the dull one, and a dull month is harder to find than it sounds.
What the Map Tells You to Do First
The map's job is to rank the lines, and the ranking is by hours that can be removed, not by hours that exist. The handling line is the biggest of the desk's lines and the hardest to shrink, because it is the work. The rework, walk-up and overhead lines are smaller and are almost entirely removable, because they are the cost of the work being done badly or twice. The waiting line is the largest of all and is shrunk by the same things that shrink the others, plus one more, which is doing the blocked tickets first. So the order of attack is usually the opposite of the order of size. The map does not tell you to make the desk faster. It tells you to stop paying for the same hour twice.
Pick the removable line with the cheapest fix, and the cheapest fix is nearly always the walk-up line. Logging walk-ups costs twenty seconds a ticket and changes nothing else. It moves sixty hours from invisible to visible, which does not save them yet, but does make every later figure on the map honest. A desk that handles five hundred requests a month and reports four hundred and twenty will get every cost per ticket and every capacity argument wrong by the same fifth. Redbrook started there. Within a quarter the ticket count was up by about a sixth and the handling hours had barely moved, which told Priya what the walk-ups had been costing all along.
Then take rework, because its three sources each have a known cure and the map has already told you which source is biggest. Redbrook's biggest was reopens, which pointed at the closing conversation rather than at the fixes themselves. The fix for that was a resolution note and a confirmation step, not a training course. Then take overhead, which is mostly a matter of removing a habit or changing a tool. With the desk's own lines tidied, take the waiting line. By now it has shrunk on its own because fewer tickets are being worked twice and more are being logged where they can be seen. The map is redrawn each quarter. The lines move. That is the point of drawing it.
Do not present the map as a case for anything on the first showing. Present it as a description, with sources, and let whoever reads it ask the question that the map was built to answer. A map shown as a case is argued with; a map shown as a description is asked about, and the asking is where the budget conversation starts to go well. How the case is then built from the numbers belongs to Using Ticket Data to Justify Resources. How it is put on one page belongs to the last article in this series. The map comes first, because the case is only as good as the map it is drawn from.
A Short War Story: The Map With One Line at Tollgate Foods
At Tollgate Foods, a desk lead called Ines asked for a third technician on the strength of the only cost figure she had. The two existing technicians were handling about three hundred tickets a month and were busy. The request was turned down because busy is not a number. Over the following year the plant's shift supervisors kept their own tally, without telling anyone. They counted the hours their people spent walking to the desk, waiting at it, and working around a broken scanner or a locked account while the desk got to them. It came to roughly the working month of one technician every month, paid for out of the plant's hours rather than the desk's. The plant manager took that tally to the same budget meeting, and the third technician was approved inside a week, on the supervisors' numbers rather than the desk's. Ines had never been wrong about needing the hire; she had simply drawn a map with one line on it, and the one line argued against her. A cost map that shows only the desk's own hours will always make the desk look like the cost, because it has left out everyone the desk exists for.
The Cost Map Template
The sheet below is the map as a form, one copy per desk per month. It is filled in from the bottom of each section upward: sources first, figures second. Section A is the budget line. Section B is the desk's own hours. The four removable lines in it each carry their biggest pieces by name, because the pieces are what you will fix. Section C is the requester line, kept apart with its own range. Section D is the reading of the map, and it is one decision, not a plan. Section E is the checklist that keeps the map honest, and the map does not leave the desk until every box is ticked. Keep each month's sheet; the second one you fill in is the trend, and the trend is what management ends up looking at.
THE COST MAP — ONE DESK, ONE MONTH
Desk: ______________________   Month: ____________   Prepared by: ______________
Was this an ordinary month? ____   If not, what made it odd: ______________________

A. THE BUDGET LINE
   A1 Technicians on the desk ..................................... ____
   A2 Working hours available after leave ......................... ____ h

B. WHERE THE DESK'S HOURS WENT (all from tickets or tally sheets)
   B1 Handling tickets (sample timestamps x count, plus triage) ... ____ h
   B2 Rework ...................................................... ____ to ____ h
        reopened tickets ____ h   repeat faults ____ h   bounced handoffs ____ h
   B3 Walk-ups and calls never logged (tally week x 4.3) .......... ____ to ____ h
   B4 Tool and admin overhead (tally week x 4.3) .................. ____ to ____ h
        biggest piece: ______________________  ____ h
        second piece:  ______________________  ____ h
   B5 Hours not on support (projects, patching, training) ......... ____ h
   B6 Check: B1 + B2 + B3 + B4 + B5 is close to A2 ................ ____ h

C. THE LINE NOBODY COUNTS (never added to section B)
   C1 Tickets sampled ____   blocked ____   partly blocked ____   merely waiting ____
   C2 Requester hours waiting, scaled to the month ................ ____ to ____ h

D. WHAT THE MAP SAYS
   D1 Largest removable line in section B ......................... ______________
   D2 Cheapest fix for it, in hours to do ......................... ______________
   D3 The one thing to change before next month's map ............. ______________

E. BEFORE THIS LEAVES THE DESK
   [ ] Every figure in B has a source a reader could check
   [ ] B2, B3 and B4 are ranges, not points
   [ ] C2 is on its own line and has not been added to any total
   [ ] Walk-ups were tallied by every technician for the same week
   [ ] The month's oddities are written at the top
   [ ] The map is a description; the case for anything comes later
Priya filled in the sheet for the month above and took it, not to Owen, but to her own team first, on a Monday, in place of the queue meeting. Dev looked at the walk-up line for a while and started logging his. Owen got the map a fortnight later as a description with sources. He asked three questions about the waiting line and wrote down a different number from the one he had the first time. It was larger. It was also the first number anyone in finance had ever had for what support cost, rather than what it was paid.
Frequently Asked Questions
Should the licence cost and the hardware go on the map?
How do I count handling hours if our ticket system has thin timestamps?
Our technicians say the tally sheet is itself overhead. Are they right?
Can I draw the map for a one-person desk?
What if the "not support" line turns out to be the biggest?
How often should the map be redrawn?
From the QuerySolv team: we build self-hosted help desk software for Windows. QuerySolv runs as one Windows service on your own network. It takes requests by web form, e-mail, live chat, social messages and REST API. It is licensed once per installation rather than per agent per month. The free trial runs the full product for 30 days.