
Reading an Aging Report by Its Shape
Friday, 16:30, at Fenwick Timber, a sawmill and merchant with a hundred and twenty staff and a desk of three. The operations manager has printed the aging report for the first time. That is because somebody at a management meeting said the word "backlog" and she wanted a number. The report is one bar chart with six bars, labelled by days, and a total: 147 open tickets. She puts it on Leo's desk and asks the only question a manager ever asks about a chart. "Is this good?" Leo looks at the bars, which are tall on the left, dip in the middle and climb again on the right, and knows the answer. He has known it for two months. The report has just made it a picture.
An aging report is a count of the open tickets in each age band. It is usually drawn as a bar chart with the youngest band on the left and the oldest on the right. It is the simplest report a help desk produces and the one that says the most. Its shape tells you whether work is flowing through the desk or settling in it. The shape can be read in five seconds by someone who has never run a queue. This article is part of our Ticket Aging & Follow-Up Discipline series. This article is the measuring end of the habits the rest of the series describes.
The article covers what the report is and is not, which clock it should be counting, and the healthy shape. Next come the three unhealthy shapes and what each one means, the action for each band, and how to read the report week over week. Then come the manager's five-minute glance and how to build the report in a spreadsheet if the tool cannot. A one-page layout follows, ready to copy. A short war story about a report that looked calm for a year sits near the end.
What an Aging Report Is and Is Not
The report is a snapshot of the open queue at one moment, sorted into bands of age. It counts tickets that are not yet closed, and nothing else: no closed tickets, no averages, no targets. The bands are the ones used throughout this series, in days: 0 to 2, 3 to 7, 8 to 14, 15 to 30, 31 to 60, and over 60. Six bars, one number each, and a total. That is the whole report. The temptation to add things to it should be resisted. That is because every added number makes the shape harder to see, and the shape is the point.
It is not a performance report, and reading it as one is the first mistake managers make with it. A tall bar at the old end is not a verdict on a technician. It is a description of a queue. Queues get that shape for reasons that are mostly structural. They include statuses that hide waiting tickets, a sweep that is not happening, a category of request that is really a project, and a vendor nobody is chasing. The report finds the shape. The sweep and the cadence, described elsewhere in this series, find the reasons, ticket by ticket.
It is also not a breach report. A breach report lists tickets that have missed a promised deadline, and it is about promises. The aging report is about time, whether or not any promise was made. A Low ticket with no target can be seventy days old and appear nowhere on a breach report. The aging report is the only place it will ever show up. Some tools have a filter for currently overdue tickets and call it a breach view. That is a list of what is late now, which is useful and different. The aging report counts what is old, late or not.
Which Clock the Report Uses
Every ticket has three ages: the time since it was opened, the time since the desk last touched it, and the time it has spent in its current status. The differences between them, and why the second one is the one a desk should manage by, are the subject of What Ticket Age Actually Measures. For the report, the choice decides what the shape means, so it has to be made deliberately and written on the report.
Most tools draw the aging report on calendar age, the time since the ticket was opened. That is because it is the easiest to compute and the one managers expect. A calendar-age report answers "how long have people been waiting?", which is a fair question for a management meeting. But its old end fills up with tickets that are long for honest reasons. Those might be a part on order, a project-shaped request, or a change scheduled for next month. Those tickets are not neglected; they are just old. A desk that works only from the calendar-age report will spend its Fridays explaining the same six legitimate tickets to the same manager.
A report on time since last touch answers the better question, "is anything being neglected?" Its old end holds only the tickets nobody has done anything to. If your tool can draw the bands on last-updated date, draw them that way and label the report to say so. If it can only draw calendar age, build the last-touched version in a spreadsheet, as described later. In that case, show the two side by side. The calendar-age version answers the manager's question, and the last-touched version drives the sweep. Never merge them. A report that is half one clock and half the other has a shape, but the shape means nothing.
The Healthy Shape
A healthy aging report is a staircase going down to the right. The tallest bar is the youngest band, because most of the queue arrived this week and is being worked. Each band to the right is shorter than the one before it. That is because tickets leave the queue as they are resolved. The longer a ticket has been open the fewer of its cohort remain. The 31 to 60 band is a handful. The over-60 band is near zero, and every ticket in it has a name, a reason and a dated next step that the desk lead could recite.
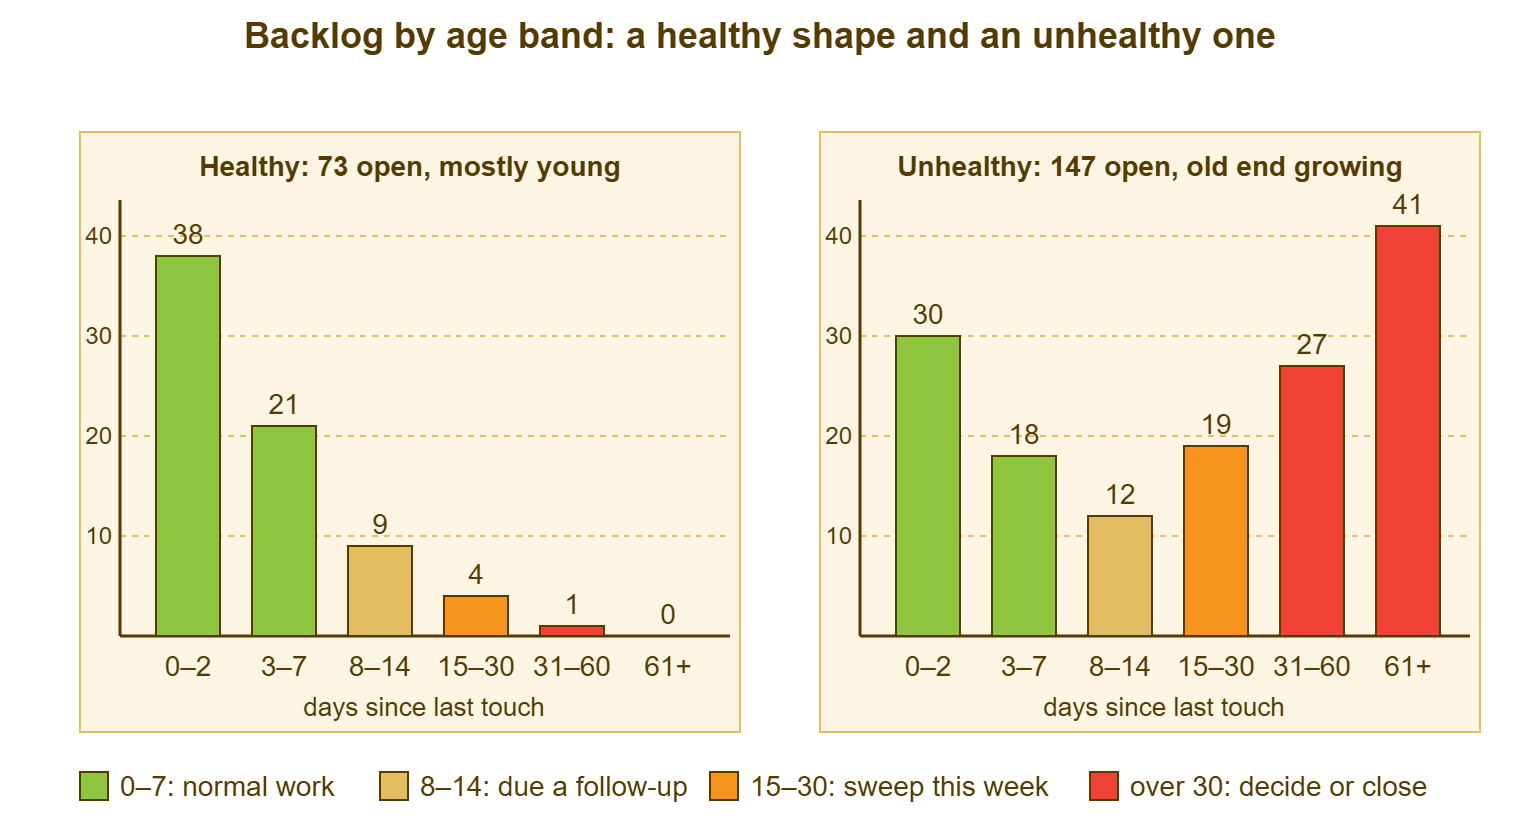
The staircase does not need to be smooth, and its height depends on the desk. A desk of three with a hundred and ten users might show 38, 21, 9, 4, 1, 0. That means seventy-three open, most of them under a week old, nothing forgotten. A desk of eight with six hundred users will show bigger bars in the same proportions. What matters is the direction. Each band should be smaller than the last. The two right-hand bands should be small enough that every ticket in them is known. A desk that can say "the four in 31 to 60 are the two supplier parts, the office move, and the licence audit, and all four were touched this week" has a healthy report, whatever the total says.
The picture below shows a healthy report beside an unhealthy one, both drawn on time since last touch. The healthy one on the left holds seventy-three tickets stepping down from thirty-eight to none. The unhealthy one on the right holds a hundred and forty-seven. The bars fall for three bands and then climb again, to twenty-seven in the 31 to 60 band and forty-one over sixty days. The colours are the actions. Green is for bands that need nothing beyond the normal cadence, and amber for the band due a follow-up. Orange is for the band the weekly sweep works, and red for the bands that need a decision.
The healthy shape has one more property that the chart cannot show and the layout at the end of this article asks for. It is roughly the same shape next week. A staircase that holds its shape week after week is a desk in balance. Tickets are leaving as fast as they arrive, and nothing is accumulating at the old end. A staircase that is slowly growing a bump on the right is a desk that is losing, slowly. The aging report is the earliest place that shows.
The Three Unhealthy Shapes
The first unhealthy shape is the bathtub: tall on the left, low in the middle, tall again on the right, as in the right-hand chart above. The young bands look normal because the desk is handling new work fine. The old bands are tall because a population of tickets has settled there and stopped moving. They are waiting on vendors nobody chases, waiting on requesters nobody nudges, waiting on decisions nobody makes, or simply avoided. The bathtub is the most common unhealthy shape. It builds over months. It is almost invisible from inside the desk because the day-to-day work feels fine. The forty-one tickets over sixty days are, every one, somebody's ticket, and most of the somebodies have stopped asking.
The second is the plateau: bars of roughly equal height all the way across. Twenty, eighteen, twenty-two, nineteen, twenty-one, twenty. A plateau looks calm, and managers often read it as "steady". But it means that tickets are not leaving the queue as they age. A cohort that arrives in week one is still mostly there in week six. The desk is touching things, perhaps, but not finishing them. The total is growing by whatever arrives minus the few that close. A plateau is a bathtub in the making. It is the shape most often produced by a desk that resolves tickets only when the requester confirms and never asks the requester to.
The third is the cliff: a very tall first bar, then almost nothing, including nothing at the old end. On a healthy small desk this can be real. More often it is the shape of a bulk close. Somebody closed everything over thirty days at the end of the quarter. The old end emptied in an afternoon. The report looks pristine for a month while the requesters whose tickets vanished are raising them again. That is why the first bar is so tall. A cliff that appears suddenly after a bathtub is a queue that was emptied rather than worked. The honest test is the reopen rate and the count of new tickets whose subject matches a closed one. The requesters remember what was closed. The report does not.
Each shape has a different first move. A bathtub needs the weekly sweep run hard on the two old bands until they are short. The sweep's three questions will sort the old tickets into nudges, dated holds, decisions and honest closes. The Stale-Ticket Sweep is the whole of that method. A plateau needs the cadence looked at. That is because tickets that are touched but never finished are usually tickets that are waiting for a confirmation nobody asked for. A cliff needs a conversation about what was closed and why, and a rule that closes are replies. If the bathtub is deep, with the two old bands holding more than the two young ones, it is no longer a shape to sweep. In that case, it is a backlog to dig out, and Taking Stock Before You Dig is where that starts.
The Action per Band
Each band on the report has an action, an owner and a deadline, and a report without them is a chart. The table is the standing instruction: what the desk does, every week, about the tickets in each band. It is written for a report drawn on time since last touch. On a calendar-age report the actions still apply but the old bands will include legitimate long tickets. Each of those should have a dated note that takes it out of the action column.
| Band (days since last touch) | Healthy share of the queue | Action this week | Who | Evidence it was done |
|---|---|---|---|---|
| 0 to 2 | The largest band | None beyond the normal cadence; check nothing High or above is unassigned | Every technician, daily | Unassigned view is empty of anything over a day old |
| 3 to 7 | Second largest | Confirm every High and above has been updated; Medium and Low are on cadence | Every technician, daily | No High ticket in this band without a reply this week |
| 8 to 14 | A third or less of the 3 to 7 band | Touch every ticket: a reply, a note with a next step and date, or a dated hold | Ticket owner, by Thursday | Each ticket has a touch dated this week |
| 15 to 30 | A handful | Weekly sweep: three questions, one of six outcomes, sweep note on each | The sweeper, Thursday | Sweep log line for the week; none left without a next step |
| 31 to 60 | Near zero; each one known by name | Decision this week: fix, dated hold with the reason, or close with a reply | Desk lead | Every ticket has a decision note and a date |
| Over 60 | Zero, or a named exception list | Manager decides each one; none closes silently; exception list written | Desk lead with the IT manager | Exception list on the report with a next-step date per ticket |
The evidence column is the one managers should read. It turns "we are working on the old tickets" into something that can be checked in a minute. A desk lead who can show the sweep log line for the week and an exception list with dates is a desk lead who does not need to be asked how the old tickets are going. A desk lead who cannot is going to be asked every Friday. The aging report will keep producing the question until the evidence column fills in.
Remember: read the shape before the total, and the two right-hand bands before anything else. A queue of a hundred and fifty with nothing over thirty days is healthier than a queue of sixty with twenty tickets nobody has touched in two months.
Reading It Over Time
One aging report tells you the shape. Four tell you the direction, and the direction is what matters. That is because every unhealthy shape started as a healthy one that drifted. Keep the weekly report, or at least its six numbers and the total, in one place, and read this week's beside the last three. The question is simple: are the two right-hand bands growing, steady or shrinking? Growing by two or three a week is a bathtub forming, and it is far cheaper to stop in week three than in month four.
Pair the aging report with a created-versus-solved count, which most tools can show. Otherwise, it is just two numbers: how many tickets arrived this week and how many closed. If more arrived than closed, the queue grew, and the aging report says where the growth went. If it went into the young bands, the desk is simply behind this week and will catch up. If it went into the old bands, tickets are aging in place, and the desk is not behind; it is stuck. Those are different problems with different fixes, and the two reports together tell them apart in a glance.
Watch for the shape that moves right as a block. If the 8 to 14 band was twelve last week and the 15 to 30 band is twelve this week, with the 8 to 14 band refilled from behind, a cohort of tickets is sliding through the bands untouched. That means the cadence has stopped and the sweep is not catching it. The report will show the slide for three weeks before the cohort reaches the old end. Three weeks is plenty of time to go and look at those twelve tickets. A bathtub, seen early, is twelve tickets. Seen late, it is forty-one.
Resist the urge to add a target line. "No more than five tickets over thirty days" sounds like discipline and becomes a reason to close the sixth one quietly on the last day of the month. The report is a measurement, and measurements that are turned into targets stop measuring. The target, if there must be one, is on the evidence column: every ticket in the old bands has a decision note and a date, every week. That target cannot be met by closing anything.
The Manager's Weekly Glance
A manager needs five minutes with the aging report, once a week, and the five minutes have a fixed order. First, the shape: staircase, bathtub, plateau or cliff, said out loud. Second, the two right-hand bands against last week's numbers: up, down or the same. Third, the exception list for the over-60 band: is there one, does every ticket on it have a next step with a date, and is any date in the past. Fourth, the sweep log line: did the sweep happen, how many went in, how many left with a next step. Fifth, one question for the desk lead, chosen from what the first four turned up, and only one.
The one question is the discipline that keeps the glance from becoming a meeting. "The 31 to 60 band went from four to nine; what moved into it?" is a question with a short answer that leads somewhere. "Why is the backlog so big?" is a question with no answer that leads to a slide deck. A manager who asks one specific question a week, from the report, will know more about the desk in a month than a manager who asks for a monthly summary. The desk lead will learn to have the answer ready, which is most of the point.
Managers also need to be told what the report is not, once, before the first glance. It is not a league table. It is not per technician. A tall old band is not evidence that someone is slacking. It is evidence that tickets are waiting on things, and the sweep finds out what. A manager who reads the report that way will ask useful questions. A manager who reads it as a performance chart will get a cliff by the end of the quarter, produced by exactly the people who were trying to please them. Explaining a backlog to management without either panic or excuses, and what to ask for when you do, is the subject of Explaining the Backlog to Management. The weekly glance is the habit that makes that conversation rare.
Building It Without a Report Module
Most ticketing tools can draw backlog by age over a window of days. Many let you choose which date the bands are drawn on. Some can only draw calendar age, and a few cannot draw it at all. In every case the fallback is the same and takes ten minutes a week. Export the open tickets with their ticket number, status, assignee, date opened and last-updated date. Open the export in a spreadsheet, and let three formulas do the sorting. Nearly every tool can export a ticket list, and the version built in a spreadsheet has the advantage that the desk chooses the clock.
Put the export on one sheet with the last-updated date in column C, and add two columns. Column D is the age in days, and column E is the band. The formulas below use the last-updated date. Swap column C for the date-opened column to get the calendar-age version. Keep both if the manager wants one and the sweep wants the other. The counts per band are six cells on a second sheet. That second sheet, kept week by week, is the over-time view from the previous section.
AGING BANDS IN A SPREADSHEET
Column C: last-updated date (or date opened, for the calendar-age version)

D2  (age in days):
  =TODAY()-C2

E2  (band):
  =IF(D2<=2,"0-2",IF(D2<=7,"3-7",IF(D2<=14,"8-14",IF(D2<=30,"15-30",IF(D2<=60,"31-60","61+")))))

Fill D2 and E2 down to the last row.

Counts per band (on the summary sheet; one cell each):
  =COUNTIF(Sheet1!E:E,"0-2")
  =COUNTIF(Sheet1!E:E,"3-7")
  =COUNTIF(Sheet1!E:E,"8-14")
  =COUNTIF(Sheet1!E:E,"15-30")
  =COUNTIF(Sheet1!E:E,"31-60")
  =COUNTIF(Sheet1!E:E,"61+")

Oldest untouched ticket (days):
  =MAX(Sheet1!D:D)
Two cautions about the export. Check what the tool means by "last updated". Some tools reset it when the requester replies, when a bulk edit touches the ticket, or when an automatic rule runs. Any of those will make a neglected ticket look fresh. If the field is unreliable, the age definitions card from the first article in this series says what a touch is. In that case, the oldest twenty tickets can be checked against the history by hand until the export is trusted. And exclude the statuses that mean the work is done. Resolved and Closed tickets are not backlog, and a report that counts them is a report of everything the desk ever did.
A Short War Story: The Flat Report at Stonebridge Insurance
Stonebridge Insurance is a regional insurer with two hundred staff and a desk of four. It had an aging report on its monthly management pack for a year. For that year it showed about twenty tickets in every band, which the pack described each month as "stable". Olu, who took over the desk in the autumn, read the same report as a plateau and pulled the history on the over-60 band. There she found thirty-one tickets that had each been touched at least once a month, with notes that said "awaiting user confirmation". Not one had a question in it that asked the user to confirm anything. The desk's habit was to set a ticket to Resolved only when the requester said the word "resolved", and to leave it waiting otherwise. The desk touched it monthly so it never looked abandoned. One of the thirty-one was an access request for the claims reporting system. It was raised by an analyst who had received the access on day four, never been asked to confirm, and been locked out again on day fifty. That happened when a quarterly access review found an open ticket and assumed the access was unapproved. The cost was a regulatory report delayed by a week and a formal complaint from the claims director. There was also a year of a management pack that had described a stuck queue as a steady one. The lesson was in the shape: a flat aging report is a queue that is being stored rather than worked. A monthly touch with no question in it keeps a ticket alive without ever letting it finish.
The report had been accurate every month. It had simply been read as a temperature when it was a diagnosis.
The Aging Report Layout
The layout below is the whole report on one page, the way it should reach a manager. It includes the shape, the six counts, the two comparisons, the exception list and the sweep line. It is text rather than a chart because the chart lives in the tool or the spreadsheet. This page is what goes on top of it. Fill it in on Friday morning from Thursday's sweep, keep every week's copy, and read four of them in a row once a month.
AGING REPORT — ONE PAGE
Desk: __________________  Week ending: __________  Prepared by: ____________
Clock used:  [ ] days since last desk touch   [ ] days since opened
Statuses counted: open and waiting states only (Resolved and Closed excluded)

THE SHAPE (tick one, say it out loud)
  [ ] Staircase (healthy)   [ ] Bathtub   [ ] Plateau   [ ] Cliff
  Total open: ____   Last week: ____   Four weeks ago: ____

THE BANDS
  Band        This week   Last week   Change   Action owner
  0-2           ____        ____       ____    all, daily
  3-7           ____        ____       ____    all, daily
  8-14          ____        ____       ____    ticket owners, by Thursday
  15-30         ____        ____       ____    sweeper, Thursday
  31-60         ____        ____       ____    desk lead, this week
  61+           ____        ____       ____    desk lead + IT manager

  Oldest untouched ticket: #______  ____ days   Owner: ______  Next step: ______

FLOW THIS WEEK
  Created: ____   Solved: ____   Net: ____
  Where the growth went:  [ ] young bands (behind)  [ ] old bands (stuck)  [ ] none

EXCEPTION LIST (every ticket over 60 days; one line each)
  #______  waiting on ____________  next step ____________  by ________
  #______  waiting on ____________  next step ____________  by ________
  #______  waiting on ____________  next step ____________  by ________

SWEEP LINE (from Thursday)
  Swept ____ / nudged __ dated __ worked __ reassigned __ escalated __ closed __
  Not reached: ____   Any date in the exception list already passed?  [ ] no  [ ] yes: ____

ONE QUESTION FOR THIS WEEK
  ____________________________________________________________________
The page is deliberately boring, and after a couple of months it should be boring to fill in as well. The shape says staircase. The change column says small numbers. The exception list has three lines with dates on them. The one question is something like "the office move ticket is due a decision on the 14th; who is making it?" A desk whose aging report is boring is a desk whose queue is being worked. The interesting ones are the ones to worry about.
Friday, 16:30, at Fenwick Timber, eight weeks later. The operations manager has the report on her desk again, this time with the one-page layout on top of it. The shape box says staircase. The 61+ line says three, with three ticket numbers and three dates beside them. The one question says "the planer control PC is waiting on the supplier's return date, due the 22nd; do you want it chased earlier?" She writes "no, 22nd is fine" on the page, and goes home. "Is this good?" was never the question. The question was whether anyone could tell, and now they can, from across the room.
Frequently Asked Questions
Should the aging report count tickets that are on hold?
How many tickets over sixty days is acceptable?
Our report is a plateau. Where do we start?
Should the report be split by technician?
Can we show the aging report on a wall screen?
How far back should we keep the weekly reports?
From the QuerySolv team: we build self-hosted help desk software for Windows. QuerySolv runs as one Windows service on your own network. It takes requests by web form, e-mail, live chat, social messages and REST API. It is licensed once per installation rather than per agent per month. The free trial runs the full product for 30 days.