
Volume as an Early-Warning System: Spikes, Rises and Drops
Monday, 08:20, at Harbourview Clinic. Aisha runs a desk of three for a clinic of four hundred staff, and on an ordinary Monday the first hour brings ten to fourteen tickets. This morning the counter says thirty-one, and nine of the subjects contain some version of "can't open the patient record". They come from three different wards. Nobody has declared anything. The clinical system's owner has not phoned. The monitoring screen, which watches the servers, is entirely green, because the servers are entirely fine. It is the thing between the servers and the wards that has failed, and no probe was pointed at it. The queue knew first. The queue usually does.
Using volume as an early-warning system means reading the count of new tickets against what is normal for that hour and that weekday. You read it as a signal about the organisation's systems and about the desk itself. It is the cheapest monitoring you own, because the probes are four hundred people who will tell you the moment something stops working, provided someone is reading what they say. Three shapes carry almost all of the signal. A spike usually means an outage. A slow rise usually means a system failing gradually. A drop means either that users have given up on the desk or that one of the desk's own doors has stopped working. This article is part of our Ticket Volume Analysis series. It is about the daily glance that catches all three.
It covers what normal is and how to know it, then the spike and the slow rise. Next come the drop that means users gave up, and the drop that means a door broke. Then come the daily glance, as a five-minute routine, what to do when each signal fires, and false alarms and how to keep them cheap. A short war story and the warning signs table to copy finish the article, in that order.
Normal First
You cannot see abnormal until you know normal, and normal for a help desk is not one number. It is a number for each hour of each weekday, because Monday at nine is not Thursday at three. A count that would be alarming on a Friday afternoon is a quiet Monday morning. The weekly shape and why it exists are described in Trends and Seasonality. For early warning, you need it at a finer grain, by hour, and you need it as a band rather than a line. "Monday, 08:00 to 09:00, ten to fourteen tickets" is a band. Fourteen is normal. Thirty-one is not, and the band is what lets you say so in two seconds without arguing about it.
Build the band from the last eight to twelve weeks of the same weekday, and make it wide enough to hold the ordinary variation. The simplest method that works is to throw out the single most extreme week, which removes the one Monday that was an outage. Then take, for each weekday and each hour, the lowest and highest counts seen in the remaining weeks. A spreadsheet does this with a count of tickets created in each hour, grouped by weekday, and a column for the lowest and highest. Write the bands down somewhere the whole desk can see them. A band nobody can see is a band nobody will use, and the glance will go back to being a feeling.
Normal also changes, slowly, and the band must move with it. Rebuild it monthly from the latest twelve weeks. Rebuild it at once after anything that changes what counts as a ticket. That includes a new department joining the desk, phone calls starting to be logged, or a monitoring integration switched on. The counting rules behind those changes are in the first article of this series. Here the point is only that a band built before the change will fire every day after it. A band that fires every day is switched off by the following Thursday. (It is switched off politely, by being ignored.)
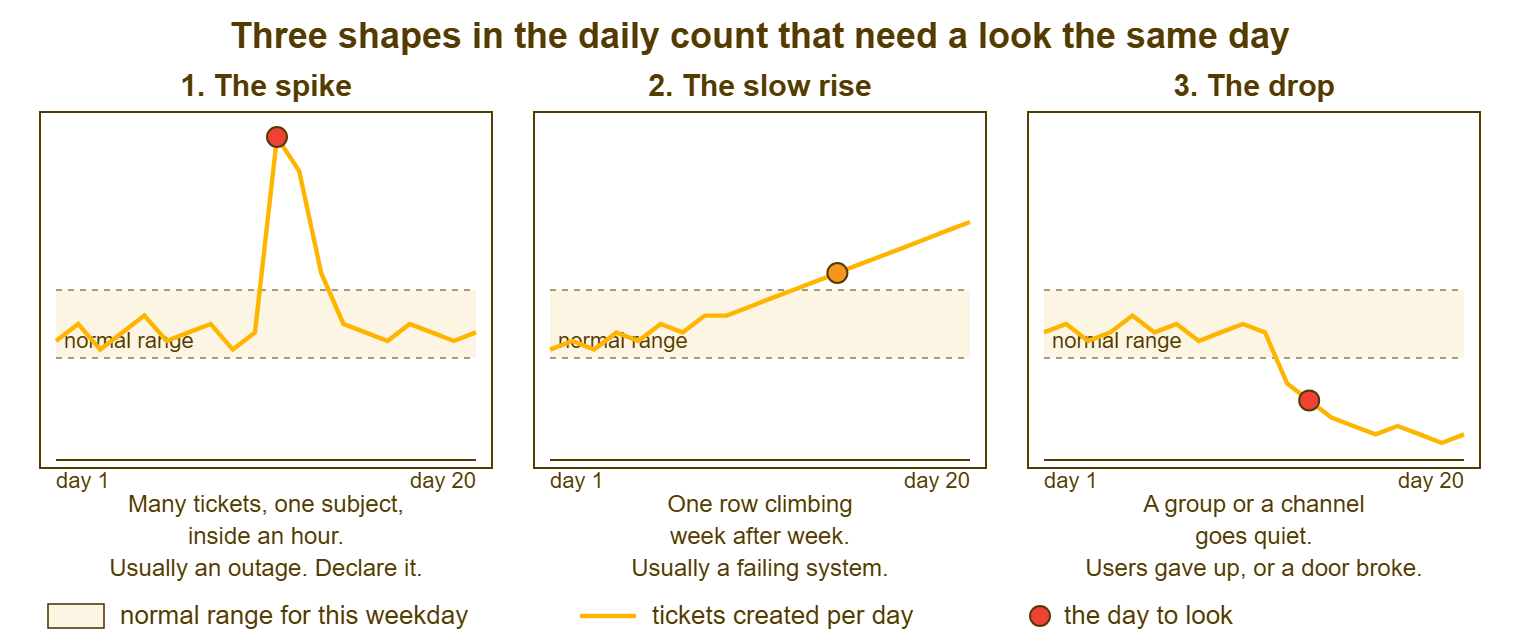
With a band in place, the daily count can do only a few things, and the picture below shows the three that matter. The first is the spike: the line jumps far above the band for a day or two and falls back. The second is the slow rise: the line climbs a little every day until, without any single alarming day, it has left the top of the band. The third is the drop: the line falls below the band and stays there. Each has a usual cause, a two-minute check and a first action, and the rest of this article takes them in turn.
The Spike That Means an Outage
A spike is many tickets in a short window, with similar subjects, from more than one person or place. All three parts matter. Many tickets on their own might be a Monday. Similar subjects on their own might be one person trying three times. Several people, in a short window, about the same thing, is an outage. A desk that waits for monitoring or for the system owner to confirm it before acting has given the outage a head start of an hour. At Harbourview, nine "can't open the patient record" tickets from three wards in twenty minutes was the whole diagnosis. The clinical system's web front end had stopped responding after an overnight update. The servers behind it were healthy, and four hundred people were about to find out one at a time.
The desk sees a spike before monitoring does more often than anyone likes to admit, for a simple reason. Monitoring watches the things somebody thought to watch, and users use everything. Take the link between the ward PCs and the front end, the certificate on an internal site, the print server's spooler, and the shared drive's permissions. Each fails in a way no probe was pointed at, and each produces a spike within minutes. This is not a reason to distrust monitoring. It is a reason to treat the ticket count as one more probe, pointed at the only thing that matters, which is whether people can work.
The first response to a spike is to stop treating the tickets as tickets. Nine people have reported one fault; working them as nine separate problems wastes the morning and tells nine people nine slightly different things. Declare it, out loud, to the desk and to whoever owns the system, and follow the routine for the first fifteen minutes set out in Declaring and the First Fifteen Minutes. Open one parent ticket for the fault and attach the rest to it. If you run QuerySolv, linking the pile to a parent ticket and merging the true duplicates keeps the count honest. It gives you one place to write the update that goes to everyone. Most tools can do something like it, and the discipline is the same whichever way yours does it. Then tell the users, early and plainly, which is the subject of The First Notice. Nothing stops a spike faster than a message that says "we know".
The Slow Rise That Means a Failing System
The slow rise is the shape nobody sees, because every individual day is inside the band. A category climbs a little each week: three tickets, then five, six, nine, twelve, fifteen. No morning is alarming. No single ticket is urgent. Each is worked, closed and forgotten, and six weeks later the desk is spending a day a week on a problem that has never once looked like a problem. At Harbourview the category was "slow log-in", and the cause was the server that held everyone's profile. It was filling up a little more each week as four hundred people's documents folders quietly grew. The log-ins got slower, the tickets got more frequent, and the first anyone said the word "disk" was in week seven.
The slow rise is caught by looking at weekly counts by category against the previous four weeks, not at daily totals against the band. Daily totals hide it, because fifteen tickets a week is three a day and three a day disappears into the noise. A weekly category count that has risen for three weeks running is the signal. It needs no arithmetic beyond reading three numbers in a row and noticing that each is bigger than the last. The monthly version of this reading, with its longer shapes, is in Volume by Category Over Time. The weekly version is the early-warning version, and it is the one that catches the disk before it fills.
The usual causes of a slow rise are things that degrade rather than break. Think of storage filling, or a licence pool running out of seats as people join. Or think of a laptop fleet passing the age where batteries and disks fail, or a wireless network with more devices on it every month than it was sized for. Or take a printer fleet past its service life. Each produces tickets that are individually minor and collectively a system failing in slow motion. The response is a problem record, opened on the pattern rather than on any one ticket, so that the cluster of small tickets becomes one piece of work with a name on it. The desk's contribution is to notice the rise three weeks in, which is about a month before anyone else will.
The Drop That Means Users Gave Up
The drop is the most dangerous of the three signals, because it looks like good news and arrives with congratulations. A department that raised twelve to fifteen tickets a month for a year raises six, then three, then one. The chart goes down, and someone says the new laptops must be working out. Sometimes they are. Often the department has stopped telling the desk about its problems. A response may have slipped to two days, or a reply may have been curt. A new manager may prefer to handle things internally, or a colleague who "knows computers" may be faster than the queue. The problems have not gone. They have gone somewhere the desk cannot see, and the organisation has quietly built a second, worse help desk out of favours.
Tell a giving-up drop from a genuine one by its shape. A genuine drop, caused by a fix, a replacement or a good article, is in one category, across every group that uses the thing. A giving-up drop is across every category, from one group. Harbourview's physiotherapy department fell from fourteen tickets a month to one, in all categories at once. The cause turned out to be a single ticket three months earlier that had waited eleven days for a reply. The department head had been embarrassed in front of a patient, and had told her staff to ask the ward's "computer person" first. The other signs come in pairs. The response-time figure for that group slipped a quarter or two before. The "as discussed" notes from technicians in that area went up. A satisfaction score, if the desk has one, fell before the volume did. The broader anatomy of a desk failing without anyone noticing is in How Support Quietly Fails, and the volume drop is its earliest visible symptom.
The response to a giving-up drop is a visit, within the week, with one question: "we have hardly heard from your team lately; is everything working, or are you fixing things yourselves?" Expect the second answer, delivered a little apologetically, followed by a list. Then fix the thing that drove them away, which the list and the department head will tell you. Watch the count come back over the following two months. A queue that goes quiet is not resting. It is being bypassed.
The Drop That Means a Door Broke
The other drop is mechanical: one of the desk's channels has stopped delivering tickets. The mailbox connection failed after a password change, or the web form's submit button broke in a site update. The chat widget's script was removed by someone tidying the intranet, or the integration that opens tickets from alerts lost its key. From the inside it looks like a quiet afternoon. From the outside, two hundred people are sending e-mails into a void and concluding, one by one, that the desk has stopped answering. By the time the first person phones to ask, the mailbox holds a day's tickets and the desk has a day's backlog and a day's worth of apologies to write.
The signature is a drop to zero in one channel while the others carry on. Twenty e-mail tickets a day becoming none since early afternoon, with the form and the phone unchanged, is not a quiet day. It is a broken pipe. The check is to send yourself a ticket through that channel and see whether it arrives. Make that test part of the daily glance for the channels that can fail silently, which is e-mail and the integrations. Do it every morning rather than when the silence has already lasted a day. The full routine for proving the mail path end to end is in Testing the Mail Pipeline. A door that has been broken for an afternoon is an inconvenience. A door broken over a weekend is Monday's spike.
Remember: read the count of new tickets against the band for this hour and weekday, every day, before the first ticket is opened. A spike is an outage until proven otherwise. A drop is a problem until proven otherwise. Neither is ever good news on its own.
The Daily Glance
The glance is five minutes at the start of the day and two minutes after lunch. Whoever is on triage does it, from the standing views the tool already has. It needs no report. It reads counts, not tickets: how many arrived, from where, about what, compared with the band. The routine below is the whole of it, in order. On most days every line is normal and the glance ends with one word in the team chat, "quiet". That is a sentence worth posting because it proves the glance was done. On the other days it ends with one of the actions in the next section, started before the first ticket is opened rather than after the fortieth.
- Today's created count so far against the band for this weekday and hour: inside, above or below?
- Yesterday's total against yesterday's band, in case the afternoon did something after the second glance.
- The subjects of the newest fifteen tickets, read as a list: are several about the same thing?
- Created by channel since yesterday: is any channel at zero that is normally not?
- Created by department or site for the week so far: is any group silent that is normally not?
- The two or three largest categories by week, this week against the last four: is any one of them rising for the third week?
- A test ticket sent through the e-mail channel this morning: has it arrived?
Some tools can automate parts of the glance. They might offer a view that highlights an hour over its band, or a notification when the count passes a threshold. Or a webhook might fire on every new ticket so a small script can keep the hourly count and send a message when it is high. Where yours can, use it for the spike, which is the signal where minutes matter. Still do the human glance for the other two, because a slow rise and a drop are patterns a threshold cannot see. Where yours cannot, the glance by eye works and always has. The tool that does early warning for a small desk is, in the end, a person who looks every morning.
When a Signal Fires
A spike gets declared, linked and communicated, in that order, within fifteen minutes, and only then worked. The declaration is to the desk and the system owner. The linking is one parent ticket with the rest attached. The communication is a first notice to the affected users saying what is known and when the next update will be. Working the tickets individually before those three things are done is the natural reaction and the wrong one. Every minute spent fixing one person's symptom is a minute the other three hundred spend raising a ticket of their own.
A slow rise gets a problem record and a name. The record describes the pattern, not any one ticket: "slow log-in tickets rising for six weeks, fifteen this week, all on the profile server". The name is the person who will read twenty of the tickets this week and find the common cause. The deadline is a week, because a slow rise is slow and a week of looking costs less than a week of tickets. The individual tickets keep being worked in the meantime; the problem record is where the pattern lives so it is not forgotten the moment each ticket closes.
A giving-up drop gets a visit within the week, as above, and whatever the visit finds gets fixed and followed up a month later with a second visit. A broken-door drop gets a test ticket in the next five minutes. If it does not arrive, the channel is treated as an outage of the desk itself. It gets the same declaration and the same first notice, this time to the users who have been writing into the void. Every one of these responses is cheap when the signal is caught the same day. Every one of them costs a multiple of that when it is caught the following week. The multiple is paid in tickets, in apologies and in the slow erosion of a department's willingness to ask.
False Alarms, and Keeping Them Cheap
The band will fire when nothing is wrong, and that is fine, because a false alarm costs two minutes of reading subjects and a real one caught late costs a day. The commonest false spikes include the Monday after a public holiday, which behaves like two Mondays. Then there is the morning a new cohort starts, which is thirty account problems in an hour and not an outage. Or consider the day a mailing goes out to all staff saying "report any issues to IT", which produces exactly what it asks for. Another is the monitoring integration having a loud night about one server. That is many tickets from one source about one thing, and is a flood, not a spike, with its own rules. Each is told from a real spike by reading fifteen subjects, which is what the glance does anyway.
The commonest false drops are a holiday period, a department away at a conference, and the desk's own definition changing. That definition change might be a channel being retired or a department moving to a different queue. Each is explained by a calendar or by the definition sheet, and each should be written on the chart so that next year's reader does not re-investigate it. The band should be wide enough that ordinary variation does not fire it and narrow enough that a real outage does. If it fires more than once or twice a week on nothing, widen it. If it missed a real spike that everyone saw, narrow it. Expect to adjust it for the first two months. Then expect to leave it alone and be slightly suspicious when it stays quiet for a month, because that usually means nobody is looking at it.
A Short War Story: The Quiet Depot at Bellweather Logistics
At Bellweather Logistics, the Northfield depot raised about twenty-five tickets a month for two years. Then, over one quarter, it raised nine, then four, then two. The desk lead, Carl, reported the fall in his quarterly summary as the first result of the new handheld scanners. The depot manager, it emerged later, had grown tired of a desk whose replies had slipped to two days during a staff shortage. She had asked her nephew, who did computers for a living, to "sort things out" for the drivers in the evenings. He had installed a remote-control tool of his own choosing on fourteen depot PCs. He had created a shared account so the drivers could all use the same log-in, and fixed a great many things quickly. The security review that found this took about forty hours. Six PCs were rebuilt from scratch, the shared account was removed and every driver re-enrolled. The depot, which had been getting same-evening fixes, now regarded the desk as the people who had taken its help away. The volume chart had shown the whole story in a single falling line for three months, and had been read as a success. A group that stops raising tickets has not stopped having problems; it has stopped telling you.
The Warning Signs Table
The table below is the glance as a reference. It covers each shape the count can take, what it looks like in the numbers, and what it usually means. It gives the two-minute check that confirms or rules it out, and the first action, with who does it. Pin it beside the screen the glance is done from. It is deliberately dull and deliberately complete. The point of writing it down is that whoever is on triage on a given morning can read a signal and start the right response without asking anyone. That includes the newest person on the desk.
| Signal | What it looks like in the count | What it usually means | Two-minute check | First action | Who |
|---|---|---|---|---|---|
| Spike, one subject | Count far above the band; most new subjects about the same thing; several people or sites | An outage of a shared system | Read fifteen subjects; name the system | Declare; one parent ticket; first notice to users | Triager, then the lead |
| Spike, mixed subjects | Count above the band; subjects unrelated | Post-holiday Monday; new starters; an all-staff mailing | Check the calendar and the HR start list | Note it on the chart; staff the morning; no declaration | Triager |
| Spike from one source | Many tickets, one requester or one integration | A monitoring flood or a mail loop | Filter by requester or channel | Pause the source; merge; fix the integration | Whoever owns the integration |
| Slow rise, one category | Weekly count up for three weeks running; no single day abnormal | A system degrading: storage, licences, ageing kit | Read twenty tickets in the category for the common thread | Open a problem record with a name and a one-week deadline | Lead |
| Slow rise, overall | Rolling four-week total climbing; categories spread | Growth, a new system bedding in, or logging improved | Compare headcount and the definition sheet | Per-head figure; note the cause; feed the forecast | Lead |
| Drop, one group, all categories | A department or site below its band for a month | Users gave up on the desk | Their response times last quarter; any "as discussed" notes | Visit the manager within the week; fix what drove them away | Lead |
| Drop, one channel, all groups | A channel at zero while others carry on | A broken door: mail, form, chat or integration | Send a test ticket through that channel now | Treat as an outage of the desk; fix; notify users who wrote in | Triager, then whoever owns the channel |
| Drop, one category, all groups | One category falls to near zero; others unchanged | A fix, a replacement or a good article worked | Did a neighbouring category rise? Are the users still there? | Record the result; keep the category at zero on the sheet | Lead |
| Drop, everything, after a change | All counts fall on the day something changed at the desk | A definition change: a channel retired, a department moved | Read the definition sheet for that date | Draw the line on the chart; rebuild the bands | Lead |
At Harbourview, the declaration went out at 08:26, six minutes after Aisha read the subjects. The first notice to the wards went out four minutes after that, before the clinical system's owner had finished his coffee. The front end was restarted by nine. The desk received eleven more tickets about it in total, instead of the hundred and fifty it would have received by lunchtime. Most of those eleven were from people who had not read the notice. Aisha's glance now takes four minutes, because she has done it every morning since, and on most mornings it ends with the word "quiet". She has stopped trusting that word when it appears too many days in a row, which is the correct amount of trust.
Frequently Asked Questions
How do I know what normal is when the desk is only a few weeks old?
Should I set up an automatic alert on ticket volume?
How many similar tickets make a spike worth declaring?
Our monitoring did not fire but the tickets did. What went wrong?
A department's volume has halved. How do I check whether they gave up on us?
Does reading the ticket count replace proper monitoring?
From the QuerySolv team: we build self-hosted help desk software for Windows. QuerySolv runs as one Windows service on your own network. It takes requests by web form, e-mail, live chat, social messages and REST API. It is licensed once per installation rather than per agent per month. The free trial runs the full product for 30 days.