
Trends and Seasonality: Reading the Shape of Ticket Volume
Monday, 07:45, the first week of September, at Larkhill Academy. Ola runs a desk of three for a school of sixteen hundred pupils and two hundred staff. By 09:00 she has sixty-one new tickets. They include new starters who cannot log in, laptops handed out on Friday that have not been set up, and a timetable system that nobody has opened since June and that has forgotten everyone. Her manager, passing with a coffee, asks the question he asks every September: "Is it getting worse every year?" Ola has three years of ticket counts in the system and genuinely does not know. Every September looks like a wall. Whether this wall is taller than the last one is a different question, and the raw numbers refuse to answer it.
A trend is the slow direction of ticket volume over months and years: up, down or flat, once the regular ups and downs are taken out. Seasonality is those regular ups and downs: the shape that repeats every week, every month and every year, on a schedule the organisation sets without consulting the desk. Volume is almost never one or the other. It is a trend with a season on top. The whole skill of reading it is in telling which part of a change is which. This article is part of our Ticket Volume Analysis series. And it assumes the counts have been defined properly, as set out in Counting Tickets Properly. Here we read them.
It covers the three rhythms, weekly, monthly and yearly, and what causes each. Next comes the rolling average, which flattens a rhythm so the trend shows through. We cover comparing like with like, which is how you answer "is September getting worse?" Then comes what a trend means and what it does not. We finish with putting the shape to work on the rota and the plan, a short war story, and the seasonality calendar to copy.
Volume Has Three Rhythms
Ticket volume moves on three timescales at once, and each one hides the others. Within a week, the count rises and falls by day. Within a month, it rises and falls by week. Within a year, it rises and falls by month. Under all three is the trend, which is the only part that tells you whether the desk's workload is actually changing. Think of the sea, once: waves every few seconds, the tide twice a day, and the sea level, which only changes if something large is going on. A desk that reads one Monday's count as a trend is reading a wave as a tide.
Each rhythm has a cause you can name, and naming it is most of the work. The weekly shape comes from how people work. The monthly shape comes from how the business closes its books and pays its people. The yearly shape comes from the organisation's calendar: terms, financial years, trading seasons, holidays. None of these is a mystery, and none of them is in the ticket system. They are in the organisation, and the ticket system is merely recording them with great accuracy and no commentary.
The practical consequence is that no two counts can be compared until you know which rhythm separates them. A Monday is not comparable with a Thursday. The last week of the month is not comparable with the second. September is not comparable with August, and never will be, however many years you wait. Every comparison in this article, and in the rest of this series, is between like and like: Monday with Mondays, month-end with month-ends, September with Septembers. That rule does more for the honesty of a volume report than any amount of arithmetic.
The Weekly Shape
On most desks Monday is the heaviest day for new tickets, and Friday the lightest. The middle of the week sits in between, a little higher on Tuesday than Thursday. The Monday peak has two causes: everything that broke over the weekend arrives at once when people sit down, and everyone who gave up on Friday afternoon tries again. At Larkhill, an ordinary October week ran sixty-one on Monday, thirty-eight, thirty-three, thirty, and twenty-two on Friday. That is a third of the week's tickets landing on one day. Your desk may differ; a desk supporting shift workers or a retail chain can peak on a Saturday. And a desk whose users work four days can have no Friday at all. Measure yours over eight or twelve weeks before you believe anything about it.
The closed count has a weekly shape too, and it is flatter, because the desk sets its own pace. Technicians close what they can in the hours they have, and the hours are the same on Monday and Thursday. The gap between the two lines is where the week's backlog is born. Monday's sixty-one arrivals against thirty-odd closures opens a gap that the rest of the week closes slowly, if it closes at all. The picture below shows twelve weeks of this at a fictional desk, created and closed per working day. The created line has a tooth every five days, which is Monday. It bumps again on the last two days of each month, which is the next section. Both lines drift gently upward across the twelve weeks, which is the trend. That is the only thing in the picture that should worry anyone.
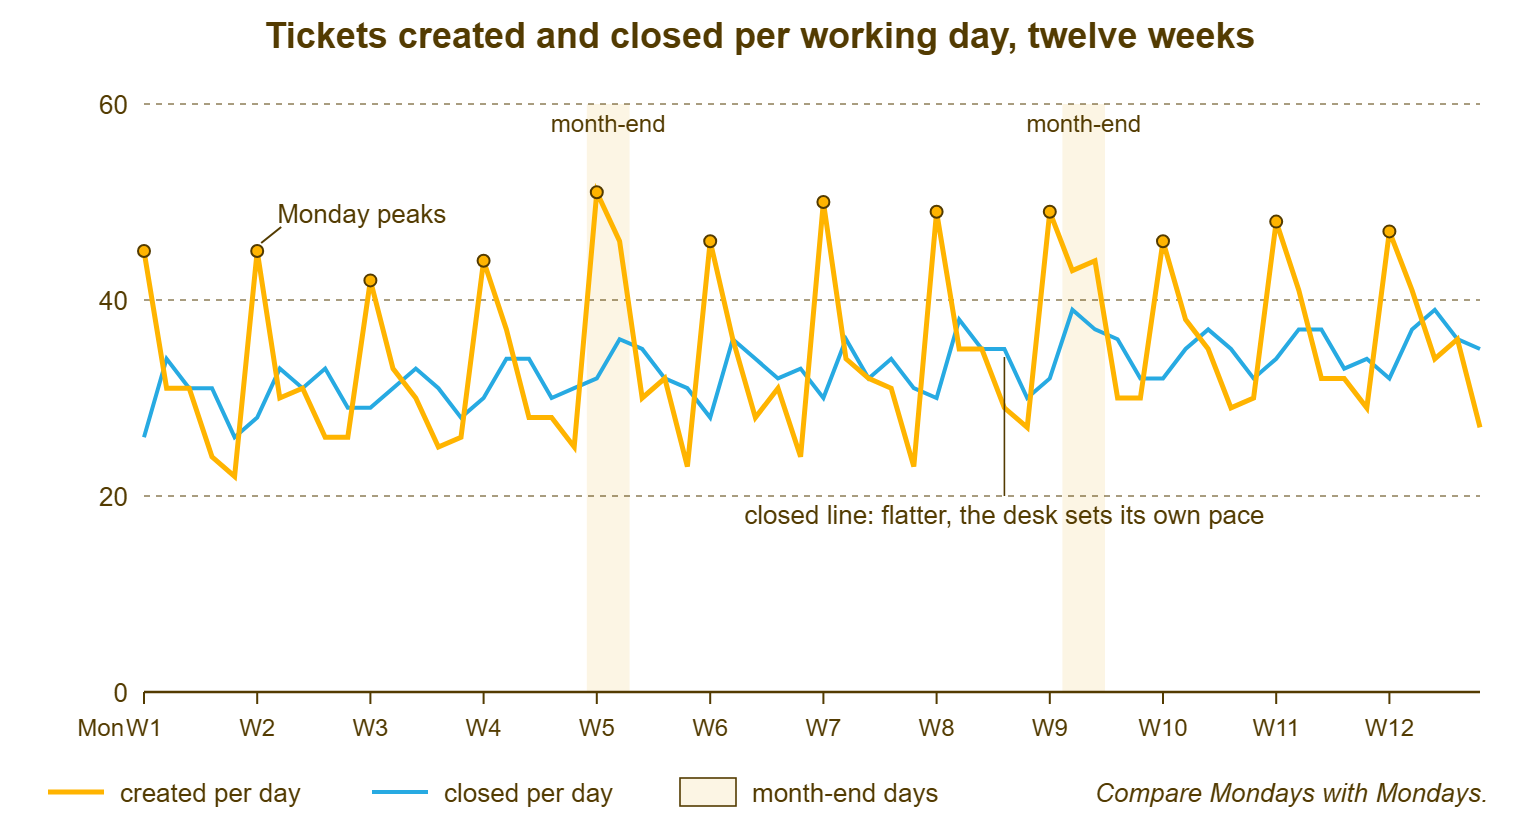
The weekly shape matters for three decisions. The first is the rota: the person who is good at the Monday morning triage should be on it, every Monday. Nobody should be on leave on a Monday if the desk can help it. The second is what a spike looks like: a Monday with eighty tickets at Larkhill is a spike. A Monday with sixty-one is a Monday, and a desk that does not know the difference will declare an incident every week. The third is reporting: a daily count shown to anyone outside the desk needs the weekly shape explained, or the reader will see a crisis every five days. Most readers, having seen it, will suggest more staff on Mondays. (They are right. It is still irritating.)
The Monthly Shape
The monthly shape is made by the business calendar. And the two busy points are the last two or three working days of the month and the first one or two of the next. Month-end is when finance runs invoicing and reporting, and when payroll goes out. It is when sales enters everything it should have entered three weeks ago. It is also when every spreadsheet that is only opened once a month is opened and found to be broken. The first day of the month brings the new starters, the access requests for the new project, and the people whose passwords expired over the weekend. The middle of the month is quieter, which is where the desk should schedule its own work.
The monthly shape is smaller than the weekly one on most desks and easy to miss, because it is spread over a few days rather than piled on one. It is also more specific to the organisation. At Larkhill, month-end is the bursar's office running fee invoices. That produces three or four tickets about the finance system on the twenty-eighth of every month like clockwork, and one about the printer the invoices come out of. At a company with a sales team on commission, month-end can double the day's tickets for two days running. Find yours by averaging the created count by day of the month across six or more months. If the last two days and the first two are higher than the rest, that is your monthly shape. In that case, the cause is in the finance department's calendar, which they will happily give you.
The Yearly Shape
The yearly shape is the largest and the slowest. And a desk needs at least two full years of counts before it can see it, three before it can trust it. Every organisation has one, and no two are the same. Schools and colleges have the start of term, a wall in September and a smaller one in January, and a quiet August that feels like a different job. Businesses with a financial year have a year-end peak in the finance department and a budget-season bump in the systems that budgets live in. Retailers have the trading peak, when nothing may change and everything breaks. Accountancy firms have the filing deadline. Food producers have the harvest. Local government has the start of the financial year and the council tax run. Then, on top of the organisation's own shape, come the holidays. There is the pre-holiday rush of people trying to finish things. There is the holiday itself, when volume drops because nobody is in, and the return, when it comes back with interest.
At Larkhill the shape is stark. The twelve months of one year ran, in created tickets: 1,210 for September, 640, 590, 480, then 720 for January, 610, 560, 430, 520, 560, 380 for the summer, and 420 for August. September is three times August. A desk that compared August with September and concluded that something had gone badly wrong in September would be wrong every year. A desk that compared this August with last August and found it a tenth higher would have learned something real. The yearly shape is the reason the only honest comparison for a month is the same month a year ago.
A desk with less than two years of data cannot see its yearly shape in the tickets, and should not pretend to. It can, however, ask. The finance director knows when year-end is, the head of operations knows when the trading peak is, and the head of a school knows when term starts to the day. Write their answers into the calendar at the end of this article as the expected shape, then check them against the tickets as the years accumulate. The organisation's calendar is the forecast until the data is.
The Rolling Average
A rolling average is the average of the most recent few periods, recalculated every period so that it rolls forward with the data. A four-week rolling average, for any given week, is that week's count added to the three before it and divided by four. Its purpose is to flatten a rhythm. Average over a whole week and the daily shape vanishes, because every average contains one of each weekday. Average over four or five weeks and the monthly shape mostly vanishes. Average over twelve months and the yearly shape vanishes entirely, because every average contains one of each month. What is left, each time, is the next rhythm up, and finally the trend.
In the spreadsheet it is one formula in plain words: for each week, take the average of this week's created count and the three weeks before it. At Larkhill, four weeks of 180, 240, 160 and 170 give a rolling figure of 187.5. When the next week comes in at 210, the oldest week drops off and the new figure is the average of 240, 160, 170 and 210, which is 195. Drawn as a line next to the raw weekly counts, the rolling average is the smooth line through the jagged one. Choose the window to match the rhythm you want to remove: four or five weeks to see the month-to-month movement, twelve months to see the year-to-year movement. Thirteen weeks, a quarter, is a good compromise for a desk that wants one line to watch.
The rolling average has one cost, and you must know it before you lean on it: it is late. A real change in demand shows up in the rolling line only gradually, as the new weeks replace the old ones. And a twelve-month rolling average takes a full year to fully reflect a change that happened in one month. This is not a flaw; it is the price of the smoothing. But it means the rolling average is for seeing the trend and never for spotting a change. Spotting a change is a different job with a different tool, covered in Volume as an Early-Warning System. I once reported volume as "flat" from a twelve-month rolling average in a month when created had risen for the sixth month running. The average was flat. The desk was not, and the desk was right.
Separating the Trend From the Season
The rolling average is one way to get at the trend. Comparing like with like is the other, and for most of the questions a manager asks it is the better one. "Is September getting worse?" is answered by comparing Septembers, and only Septembers, per working day, across every year you have. At Larkhill the three Septembers ran 1,050, 1,130 and 1,210 created. Each had twenty-one working days, so per working day they ran fifty, fifty-four and about fifty-eight. September is getting about a twelfth busier each year. That is a trend, and it is visible only because the comparison removed the season by construction.
Ask the next question straight away: why? A trend has a cause, and the cause decides what to do about it. Larkhill's pupil roll had grown from fourteen hundred to sixteen hundred over the same three years, which is about a seventh. So most of the rise in September tickets was more people, not worse systems. The remainder was two hundred more pupils bringing their own devices onto a wireless network that had not grown with them. Tickets per hundred users per month is the figure that separates "more people" from "more problems per person". It belongs on the same sheet as the raw count whenever the organisation's size is changing.
The same method works at every scale. Is this Monday high? Compare it with the last twelve Mondays. Is month-end getting heavier? Compare the last three days of each month across a year. Is the whole year up? Compare the twelve-month total with the previous twelve, or the twelve-month rolling average with its value a year earlier. In each case the comparison is between periods that share a season, so that whatever difference remains is trend, noise, or a real event. The noise shrinks as you add more periods to each side. Three of each is the least that means anything. One of each is an anecdote with a chart.
For a cleaner single number, divide each month's count by that month's usual share of the year. That gives a season-adjusted count that can be compared across months directly. That calculation, the seasonal multiplier, is the second ingredient of a forecast and is built step by step in Forecasting Volume Simply. For reading the past, same-month comparison is enough, and it has the advantage of needing no explanation to anyone.
Remember: compare like with like, always per working day: a Monday with Mondays, a month-end with month-ends, a September with Septembers. Use the rolling average to see the trend, never to spot a change, because it is a year late by design.
What a Trend Means and What It Does Not
A rising trend means one of four things, and the volume alone cannot tell you which. More people are being supported. More systems are being supported. The same systems are generating more tickets per person, which is a system getting worse or users getting less able. Or the desk is logging more of what it was already doing, which is a definition change and not a trend at all. Check them in that order. The first two are answered by a headcount and a list. The third is answered by reading the categories, and the fourth by the definition sheet from the counting article. A rising line that turns out to be more users is a staffing conversation. A rising line that turns out to be one system is a conversation with that system's owner, and a much cheaper one.
A falling trend is the same question in reverse. And it is the more dangerous of the two, because it is the one everybody is pleased to see. Volume falls for several reasons. A system was fixed or replaced, or a knowledge base article is answering the question first. People left, or a department moved onto a system the desk does not support. Or people stopped bothering to raise tickets. The last is the bad one, and it looks exactly like the others on a chart. Before anyone takes credit for a falling line, ask the department that fell silent whether they are still having problems. They usually are.
A flat trend, finally, is not nothing. A desk whose volume has been flat for two years while the organisation grew by a quarter has quietly got better per head, and should say so. A desk whose volume is flat while the organisation shrank has quietly got worse. The trend only means something next to the size of the thing it is measuring. And the thing it is measuring is the organisation, not the desk. The same is true of volume next to the desk's other numbers. Reading them as a set rather than one at a time is the subject of Reading Metrics Together.
Putting the Shape to Work
The weekly shape goes on the rota. Put the strongest triager on Monday morning. Hold the desk's own project work for Wednesday and Thursday afternoons. And treat Friday afternoon as the time to clear the waiting list rather than to start anything. The monthly shape goes on the rota too. Have nobody on leave on the last two working days of the month, and a technician primed on the finance systems for those days. Both shapes go into the coverage plan, which is the subject of The Coverage Calendar. The volume numbers are the evidence that plan rests on.
The yearly shape goes on the plan written months ahead. Larkhill's September is known in June. The desk can build the new-starter accounts in August and pre-stage the laptops. It can write the three articles that answer the three questions every new pupil asks. And it can bring in a temporary pair of hands for the first fortnight of term. Every one of those is cheaper in June than in September. And all of them depend on someone having drawn the line through three Septembers and shown it to the head in a meeting. The organisation has been telling the desk about September for years. The chart is how the desk finally hears it.
The counts themselves come straight out of the tool. If you run QuerySolv, the standard volume report gives you created and closed by week and month. The rolling average, the same-month comparison and the per-working-day figure are columns you add in the spreadsheet. That is true of nearly every help desk tool, because the tool knows your tickets and not your calendar. The calendar is the thing you bring. The chart will show you the shape; it takes a person to say "that bump is the bursar".
A Short War Story: The Flat Line at Stonebridge Insurance
At Stonebridge Insurance, a desk lead called Dev reported ticket volume to the operations director each quarter as a twelve-month rolling average. It had sat at around seven hundred a month for two years. He described it, accurately, as flat. In the spring a new claims system went live, and from April onward the monthly created count rose every month: 740, then 790, 830, 880 and 920 by August. The rolling average, with seven old months still in it, crept from 700 to about 760 and the quarterly report said "slight upward drift, within normal variation". The renewal season, which was Stonebridge's yearly peak, arrived in October on a desk already a hundred and fifty tickets behind. The backlog passed three hundred by November. Two technicians worked six weekends in a row, roughly a hundred and fifty hours of overtime. The director asked why nobody had warned him when the monthly numbers had been warning everyone since May. A rolling average is for seeing the trend, and it will tell you about this month's change in about a year.
The Seasonality Calendar
The calendar below is the organisation's year as the desk experiences it, one row per month. Fill the business-events column from the people who own the calendar, finance, HR, operations and the heads of any department with a season. Fill the desk-events column from your own plans: rollouts, migrations, the summer rebuild. The expected-shape column is your judgement, high, normal or low. The last two columns are filled from the data, one year at a time. After three years the calendar is a forecast that the finance director will accept without argument. Keep one row at the bottom for the weekly and monthly shapes, which do not change by month but should be written in the same place.
SEASONALITY CALENDAR — ONE PAGE
Desk: ______________________   Year: ______   Prepared by: ______________

Month   Expected   Business events            Desk events            Created per     Cover needed
        shape      (finance, HR, ops)         (rollouts, rebuilds)   working day
                                                                     last yr / this yr
Jan     ________   _______________________    ___________________    _____ / _____   ____________
Feb     ________   _______________________    ___________________    _____ / _____   ____________
Mar     ________   _______________________    ___________________    _____ / _____   ____________
Apr     ________   _______________________    ___________________    _____ / _____   ____________
May     ________   _______________________    ___________________    _____ / _____   ____________
Jun     ________   _______________________    ___________________    _____ / _____   ____________
Jul     ________   _______________________    ___________________    _____ / _____   ____________
Aug     ________   _______________________    ___________________    _____ / _____   ____________
Sep     ________   _______________________    ___________________    _____ / _____   ____________
Oct     ________   _______________________    ___________________    _____ / _____   ____________
Nov     ________   _______________________    ___________________    _____ / _____   ____________
Dec     ________   _______________________    ___________________    _____ / _____   ____________

WEEKLY SHAPE (from the last twelve weeks)
   Heaviest day: ________  share of the week: ____   Lightest day: ________
   Rota rule: ______________________________________________________________

MONTHLY SHAPE (from the last six months)
   Busy days: last ____ working days and first ____ of the month
   Cause (ask finance): ____________________________________________________
   Rota rule: ______________________________________________________________

COMPARISON RULES
   [ ] Months compared per working day, and only with the same month a year ago
   [ ] Rolling average window used for the trend line: ____ weeks / ____ months
   [ ] Definition changes marked on the chart (see the volume definition sheet)
Ola filled in the calendar that September, mostly from memory and the bursar. She took it to the head in June the following year with three Septembers drawn on one chart. The desk got a temporary technician for the first two weeks of term and the authority to build the new-starter accounts in August. The following September had sixty-eight tickets by 09:00 on the first Monday, which was more than ever, and the desk cleared them by lunch. The wall had not got any smaller. The desk had simply seen it coming.
Frequently Asked Questions
How much history do I need before I can see seasonality?
Should I use a four-week or a thirteen-week rolling average?
Our Mondays are not the peak. Is something wrong with our data?
How do I handle a week with a public holiday in it?
Should I count calendar weeks or working weeks?
One of our two years of data includes a tool migration. Can I still read the yearly shape?
From the QuerySolv team: we build self-hosted help desk software for Windows. QuerySolv runs as one Windows service on your own network. It takes requests by web form, e-mail, live chat, social messages and REST API. It is licensed once per installation rather than per agent per month. The free trial runs the full product for 30 days.