
Reading Metrics Together, Not One at a Time
The first Monday of the month, 08:30, at Bluewater Bank. Elena runs the six-person support desk for the head office and nineteen branches. She has the month's numbers in front of her when Kwame, the branch operations director, passes with a coffee and asks, "Good month?" The median time to resolve a ticket has fallen from nine business hours to five. By the only number Kwame has ever asked about, it is the best month the desk has had. Elena says "give me ten minutes", because she has not yet looked at the number next to it. Reopens have gone from fourteen to thirty-one. The desk did not get faster. It got earlier at saying it had finished. If she had read one number she would have reported a good month and been wrong in front of a director. That is the kind of wrong that is remembered.
Reading metrics together is the habit of never looking at one number without the number that would catch it lying. A pair is two metrics where the first can be improved by a shortcut and the second shows the shortcut. The six metrics in this series fall into three such pairs. This article is part of our Helpdesk Metrics That Matter series. And it is about the three pairs and the handful of extra reads that go with them. It covers the monthly read that takes fifteen minutes, and the one page the whole thing fits on.
It covers why one number lies. Next come the three pairs in turn, volume with backlog, resolution time with reopens, and first response with satisfaction, with a picture. Then we cover the third reads, response rate, sample size and the trend, and the monthly read minute by minute. We finish with the four verdicts a month can get, a short war story, and the one-page scorecard to copy, in that order.
Why One Number Lies
A single metric lies in three ways, and none of them involves anyone lying. The first is the shortcut: the number improved because someone found a quicker way to move it than doing the work. That is the whole subject of metric gaming and its cures. The pair is the cheapest defence against it. The second is the population shift. The number improved because the mix of tickets changed. Two hundred password resets arrived after a security change and dragged the median down. Nothing about the desk is different. The third is small numbers: the number moved because nine people answered a survey instead of fourteen, and nine people can move anything.
The pair catches all three. A shortcut moves one number and damages its partner. A population shift moves one number and leaves its partner oddly still, which is itself a tell. Small numbers show up as a response rate or a sample count beside the figure, which is why those are read as part of the pair and not as footnotes. The underlying rule is that every metric in the handful answers one question and cannot answer the question next to it. That is why the handful worth tracking gave each one a "read with" line. This article is that line, expanded to fill a page.
Reading in pairs also changes what a good month looks like, which is the part that takes getting used to. A good month is no longer a number that went the right way. It is two numbers that moved together in the right direction, or one that improved while its partner held. Or, most often, it is six numbers that did not move much. That is what a desk that is keeping up looks like from the inside. Nothing in that sentence makes a good slide. It makes a good desk, which is what the numbers were for.
Pair One: Volume With Backlog
Tickets created and tickets resolved in the month are read beside the backlog at month end, cut by age, with the oldest ticket named. The arithmetic between them is the check. This month's created minus this month's resolved should be the change in the backlog, give or take a few tickets that were cancelled or merged. If it is not, one of the counts is wrong and the month's reading stops until someone finds out which. At Bluewater the month was 402 created and 395 resolved, so the backlog should have grown by about seven. It went from 118 to 125, and the first pair agreed with itself.
The pair catches the closed-count illusion. A desk can resolve more tickets than it ever has and leave its backlog older than it has ever been. That is because the tickets being resolved are the quick ones and the ones being left are not. The closed count on its own would call that month a record. The age bands say otherwise. If the count of tickets over thirty days old rose while the resolved count rose, the desk did the easy work and walked past the hard work. The oldest ticket's age tells you how long one particular person has been walked past. Bluewater's over-thirty count fell from twenty-two to nineteen and the oldest ticket from sixty-one days to forty-seven, so the pair was clean. It is not always.
The pair also catches the falling count. Consider a desk with created tickets falling month on month beside a flat backlog and flat everything else. It may have fixed something or may have lost a department to a technician's personal inbox. The two look identical from inside the queue. The pair cannot tell you which. It can tell you to go and look, by department, which is the read in volume as an early-warning system. A quiet month is the one verdict in this article that should make a desk lead nervous. And it is the one most often reported as good news.
Pair Two: Resolution Time With Reopens
The median and 90th percentile time to resolution are read beside the count of tickets reopened within the desk's window and the reopen rate those make. The two are opposed by nature: the fastest way to improve resolution time is to mark tickets resolved sooner. And the surest way to raise reopens is the same act. A month in which resolution time fell and reopens rose is a month in which the desk moved the line between "fixed" and "sent a fix". Nothing else need have changed. That was Bluewater's month: median down from nine hours to five, reopens up from fourteen to thirty-one.
The reading is in the direction of each, not the size. Resolution time down and reopens flat is a genuine improvement, and worth asking what caused it so it can be kept. Resolution time down and reopens up is early resolving. The next step is the ten-ticket sample from the gaming article. At Bluewater, that took twenty minutes. The sample found that a new technician, Theo, had been resolving tickets at the moment he sent the fix. That was because the previous desk he worked on had done that. It was a coaching conversation about what resolved means, not a disciplinary one. And the reopens came back down the following month with the resolution time a little higher and honest. Resolution time up and reopens flat is a desk that got slower or got harder tickets. The cut by category in the time to resolution series says which.
The 90th percentile is read in this pair for a reason the median cannot cover. A few tickets waiting weeks on a supplier do not move the median and do move the 90th. So a month in which the median held and the 90th doubled is a month with a slow tail. And the slow tail is where the requester who phones the director lives. Read the slowest ten tickets by number once a month. They are rarely a surprise to the technicians and almost always a surprise to the lead. And the gap between those two facts is the whole reason for reading them.
Pair Three: First Response With Satisfaction
The median and 90th percentile time to first reply are read beside the satisfaction ratings. These are themselves read as three numbers: ratings received, good ratings, and the response rate. First response is the number most easily improved by a template that says nothing, and satisfaction is the number that notices. That is because a requester who was acknowledged in four minutes and then heard nothing for a week rates the week, not the four minutes. A month in which first response fell and satisfaction fell is a month in which replies got faster and emptier. A month in which both improved is a month in which the first reply told people something.
Bluewater's third pair was flat. First response median was at about an hour both months. There were forty-four good ratings in fifty-eight against fifty-two in sixty-one the month before. There was a response rate of roughly one requester in seven each time. Elena read the fourteen low or middling ratings, which took ten minutes because most had a comment. Eight of them were on tickets Theo had resolved early. The third pair had found the same thing as the second, from the other side. When two pairs point at the same cause the reading is over.
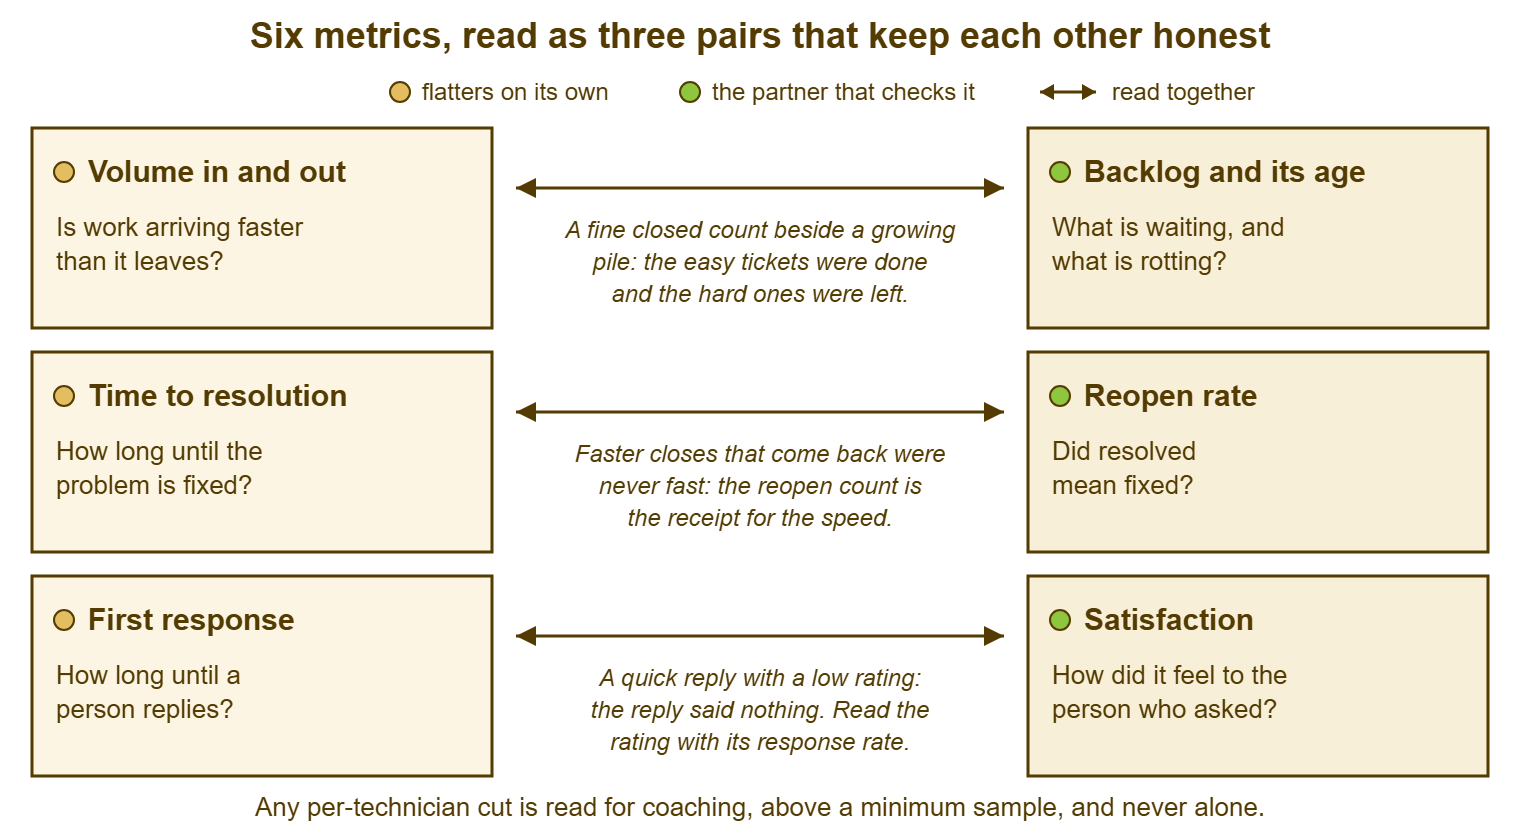
The picture below is the three pairs drawn as cards. On the left of each row is the number that flatters when it stands alone. On the right is the partner that keeps it honest, with a line between them saying what the pair catches. Read it as the layout of the scorecard at the end of this article, which is the same three rows with blanks. The point of drawing it is that there are only three rows, and three rows is a page.
The Third Reads: Response Rate, Sample Size and the Trend
Three more reads sit beside the pairs and take a minute each. The first is the response rate on satisfaction, which decides whether the score means anything this month. Forty-four good ratings in fifty-eight is a reading. Six good in seven is an anecdote. A desk that reports a score from seven ratings as a percentage has reported the opinions of seven people with a confidence they did not ask for. Write the counts, write the response rate, and when the count is small, say so in the sentence. The methods for reading around who tends to answer are in response bias. The short version for the monthly read is that the comments are worth more than the score whenever the count is under about twenty.
The second is the per-technician rule, which applies the moment anyone cuts any of the six by name. A per-person number is for coaching and never for ranking. It is read by the lead and not displayed. It is not read at all until the sample is large enough. Bluewater uses twenty resolved tickets or ten ratings in the month. A desk can set its own threshold as long as it writes one down. Below that, the figure is a story about which tickets a person happened to draw. Above it, it is a question to ask the person, not an answer about them. Theo's reopens were read this way, as the reason for a conversation. The conversation would have been the same if the number had been half as large.
The third is the trend, which is why the scorecard has three columns and not one. A single month's figure beside last month's is a direction; beside three months, it is a trend or a wobble. And the difference matters because wobbles are not acted on and trends are. Volume moves with the calendar, satisfaction wobbles with small numbers, and reopens vary with whoever was on leave. So a number that moved one month and moved back the next is weather. A number that has moved the same way for three months is the thing the month's one action should be about. Read the three columns before writing the sentence.
Remember: never report one number without the one that would catch it lying. Volume with backlog, resolution time with reopens, first response with satisfaction, satisfaction with its response rate, and any per-technician figure with its sample size and for coaching only. A number that improved while its partner got worse did not improve.
The Monthly Read in Fifteen Minutes
The read happens on a fixed day each month, at the same time. Have the scorecard from the end of this article in front of you and the three previous months' scorecards beside it. The first two minutes are copying: created, resolved, backlog by band, oldest ticket, the two medians and two 90th percentiles, reopens, ratings received, good ratings, requests sent. If you run QuerySolv, the standard reports already hold volume, backlog by age, response and resolution times, reopens and satisfaction, so the copying is short. In any tool, the first month's read takes longer than fifteen minutes because you are finding where the numbers live. Every month after that it does not. Where the tool cannot produce one of them, the spreadsheet in starting metrics on a small desk fills the gap.
Minutes two to five are the first pair: created against resolved, the difference against the change in backlog, and the age bands against last month's. Minutes five to eight are the second pair: the direction of the resolution medians against the direction of reopens, and the 90th percentile for a slow tail. Minutes eight to eleven are the third pair: first response against satisfaction, and then the low ratings themselves, every one, with the comments. That means under a dozen ratings on a small desk. Reading them is the single most informative thing in the fifteen minutes. Minutes eleven to thirteen are the trend: run a finger across the three columns for each row and mark anything moving the same way three times. The last two minutes are writing.
The writing is three sentences and one action, and they go on the bottom of the scorecard. What moved. Why we think it moved. The one thing we will do about it this month, with an owner and a date. One action, not five, because five actions in a month is a plan nobody follows and one is a thing that gets done. Elena's three sentences for the month were: "Resolution time fell and reopens doubled. Tickets were being resolved when the fix was sent, mostly by one new starter who was trained that way elsewhere. Theo and I are agreeing what resolved means this week, and I will re-read the sample next month." The ten-ticket sample, which is half an hour, happens separately, and only when the second pair asks for it. This month it did.
The Four Verdicts a Month Can Get
Most months fall into one of four shapes once the pairs have been read. Naming the shape is what turns six numbers into a sentence a director will understand. The table below gives the four, what the pairs look like in each, and what the month's one action usually is. Many months are "keeping up" and need no action beyond writing it down, which is a perfectly good month and a disappointing slide. The dangerous verdict is the fourth one, because it is the one most often mistaken for the first.
| Verdict | Pair one: volume and backlog | Pair two: resolution and reopens | Pair three: first response and satisfaction | The usual one action |
|---|---|---|---|---|
| Keeping up | Created and resolved about equal; backlog flat or falling; oldest ticket getting younger | Both steady | Both steady; response rate steady | None; write it down and read the slowest ten tickets anyway |
| Busy | Created above resolved for two or more months; backlog growing, especially over thirty days | Speed holding or slipping; reopens steady | First response slipping at the 90th percentile; ratings steady | A capacity conversation with the evidence from the backlog growth and the hours arriving |
| Fast but brittle | Resolved count up; backlog flat | Speed improved while reopens rose | First response improved while ratings fell, or comments mention being closed too soon | Sample ten resolved tickets; agree what resolved means; fix the incentive, not the person |
| Quiet | Created falling for two or more months; backlog flat | Steady or improving, because the remaining tickets are easier | Response rate falling; fewer ratings; a department missing from the comments | Cut created tickets by department against headcount; ask the quiet department how they got help last time |
Bluewater's month was "fast but brittle". The sentence Elena gave Kwame when he came back past her desk was the verdict and the cause in one breath: "A brittle month. Resolution time looks better because tickets were being resolved before the fix was confirmed, and reopens doubled to show for it. One conversation fixes it, and I will tell you next month whether it did." Kwame said that was more than he usually got, which Elena chose to take as praise.
A Short War Story: The Best Quarter at Ivybridge Veterinary Group
Ivybridge Veterinary Group's support desk, two technicians serving eleven practices, reported a median resolution time to the practice managers' meeting each quarter and nothing else. In one spring quarter the desk lead, Marta, reported its best figure ever, a median of under four business hours, down from seven. The managers were pleased, and the figure was quoted in a paper arguing that the desk did not need the third person it had asked for. Nobody at the meeting had seen the reopen count, which had gone from about twelve a month to about forty, or the waiting queue, which had tripled. The figures had risen because a practice-management system update had left dozens of workstations half working. The technicians, swamped, had been sending fixes and resolving on send. The reopened tickets included one from the Harbourside practice about the dispensing printer, resolved four times in three weeks. During those weeks, the nurses hand-wrote labels. The practice later estimated between twenty and thirty hours of staff time lost. There was one near miss on a dosage that the manager described at the next meeting in some detail. Marta rebuilt the quarterly figure as a one-page scorecard with resolution time and reopens on the same line. The third person was approved at the meeting after that. A number reported alone will be believed alone, and the better it looks, the more it will be used against you.
The One-Page Scorecard
The scorecard is the three pairs with blanks, three columns wide so the trend is visible. There is a box at the bottom for the verdict, the three sentences and the one action. Fill it in on the same day each month from the definitions the desk has written down. Name the definition sheet versions at the top so nobody has to ask what "resolution time" means on this page. File the completed sheets in order. The stack is the desk's history and the quarterly review is built from it. It is one page on purpose. A scorecard that needs a second page has stopped being read together and started being a report, and reports have a different article.
MONTHLY SCORECARD — ONE PAGE, SIX NUMBERS IN THREE PAIRS
Desk: ______________   Month: ______________   Read by: ______________   Date: ________
Definition sheets used (versions): ________   Business hours: ____:____ to ____:____

PAIR ONE — KEEPING UP?                            this month   last month   month before
  Tickets created ............................... ______       ______       ______
  Tickets resolved .............................. ______       ______       ______
  Backlog at month end .......................... ______       ______       ______
    under 7 days / 7 to 30 / over 30 ............ __/__/__     __/__/__     __/__/__
    oldest open ticket (days, ticket number) .... ______       ______       ______
  Created minus resolved matches the backlog change:  [ ] yes   [ ] no: ______________

PAIR TWO — FAST, AND DID IT HOLD?
  Time to resolution, median (business hours) ... ______       ______       ______
  Time to resolution, 90th percentile ........... ______       ______       ______
  Reopened within ____ days of resolution ....... ______       ______       ______
  Reopen rate (in 100) .......................... ______       ______       ______
  Speed improved while reopens rose:  [ ] no   [ ] yes, sample ten resolved tickets

PAIR THREE — HEARD FROM, AND HOW DID IT FEEL?
  First response, median (business hours) ....... ______       ______       ______
  First response, 90th percentile ............... ______       ______       ______
  Created this month and not yet replied to ..... ______       ______       ______
  Ratings received / requests sent .............. ___/___      ___/___      ___/___
  Good ratings .................................. ______       ______       ______
  Low ratings read, with comments:  [ ] all    Followed up with the requester:  [ ] all

TREND
  Rows moving the same way for three months: ______________________________________

THE READ
  Verdict:  [ ] keeping up   [ ] busy   [ ] fast but brittle   [ ] quiet   [ ] other: ________
  What moved: ______________________________________________________________
  Why we think it moved: ___________________________________________________
  One action this month: ____________________________  owner: ________  by: ________
  Last month's action done:  [ ] yes   [ ] no: ______________
  Per-technician figures read:  [ ] none   [ ] lead only, above ____ tickets, for coaching
The line most desks skip is "last month's action done". And it is the one that makes the scorecard a routine rather than a monthly event. Elena's scorecard for the following month had reopens back at sixteen, resolution median at seven hours, and the box ticked. Kwame asked whether the desk had got slower. She said it had got honest by two hours, and showed him the two rows side by side. And he has read them that way since.
Frequently Asked Questions
What if the two numbers in a pair both got worse?
Can the scorecard go to management as it is?
How many months of history do I need before the trend column means anything?
Which pair should I read first if I only have five minutes?
Should the whole team see the scorecard?
We have service-level targets. Do those replace the pairs?
From the QuerySolv team: we build self-hosted help desk software for Windows. QuerySolv runs as one Windows service on your own network. It takes requests by web form, e-mail, live chat, social messages and REST API. It is licensed once per installation rather than per agent per month. The free trial runs the full product for 30 days.