
Survey Response Bias and How to Read Around It
The first Monday of September at Bluewater Bank, 08:30. Yusuf runs the six-person desk. The August satisfaction figure is on his screen: 78 percent good, down from 83 in July and 85 in June. The chart draws a line through the three points and the line goes down. Before he has finished his coffee there is a message from the head of operations: "Saw the satisfaction dip. What happened in August?" Yusuf scrolls down to the count. Nine people answered the survey in August, out of 210 tickets closed with a reply. That was because half the back office was on leave and the other half were covering. Seven said good. One said okay. One said poor. The one who said poor had been sent a replacement keyboard with the wrong layout. That is what happened in August.
Response bias is the gap between the people who answer a survey and the people who were asked. It is the single largest fact about any satisfaction score. The people who click are not a random sample of the requesters. They are the ones who felt something strong enough to spend ten seconds on the survey. That means the delighted and the furious are over-represented and the large, adequately served middle is nearly absent. Add the small numbers a one-to-ten-person desk produces. And the monthly score becomes a figure that moves for reasons that have nothing to do with the service. This article is part of our Measuring Satisfaction series. It is about reading the score in full knowledge of who is in it, how few of them there are, and what that does to the number.
It covers who answers and why; the silent middle, drawn as a picture; the small-numbers problem. Next come the month with nine responses as a worked example and how many answers a figure needs before it can be read. Then come the bias the desk adds itself, non-response as information in its own right, and reading comments over scores. It then covers reading around the bias by reporting the shape rather than the point. A short war story and the bias checklist to copy follow, in that order.
Who Answers: The Delighted and the Furious
People answer a survey when the answer is worth the effort to them, and the effort is only worth it when they feel something. The delighted answer because the desk did something they did not expect. That might be a fix in ten minutes, a technician who came to the desk, or a problem that had dragged for weeks ended in an afternoon. Gratitude wants somewhere to go. The furious answer because the survey is the first place the desk has offered them to say so. And they have been composing the comment since Tuesday. Both groups are real. Both are telling the truth. Neither is typical.
The typical requester is the one whose printer was fixed by Thursday, which was roughly when they expected. The technician was polite, which was roughly what they expected. They read the resolving reply. They notice that the printer works. And they go back to the thing they were doing before the printer broke. They are not withholding an opinion. They do not have one strong enough to click on. If you stopped them in the corridor and asked, they would say "fine". And "fine" is the most common experience of any decent desk and the least likely to appear in its survey.
The result is a U-shaped sample drawn from a hump-shaped population. Most requesters sit in the middle, and most answers come from the ends. The score that results is not wrong, exactly; every click was honest. It is a score for a group the desk did not choose. The group changes from month to month depending on who happened to be delighted or furious. That is why the number moves when the service has not. The first article in this series, What a Satisfaction Score Actually Measures, sets out what the score describes. This one is about the gap between that and what people assume it describes.
The Silent Middle
The picture below makes the shape visible, using one month at the fictional Bluewater desk as the example. The left panel is a thought experiment. It shows how all four hundred people whose tickets closed that month felt, if every one of them had been asked in person and answered honestly. Fifteen were furious. Forty-five were unhappy. Two hundred and forty thought it was fine and got on with their day. Seventy were pleased and thirty delighted. That is a hump, and the hump is what a competent desk's requesters usually look like. The right panel is who actually answered the one-question survey. There were ten of the fifteen furious, seven of the forty-five unhappy, and five of the two hundred and forty in the middle. There were nine of the seventy pleased and seventeen of the thirty delighted. Forty-eight answers, and a U.
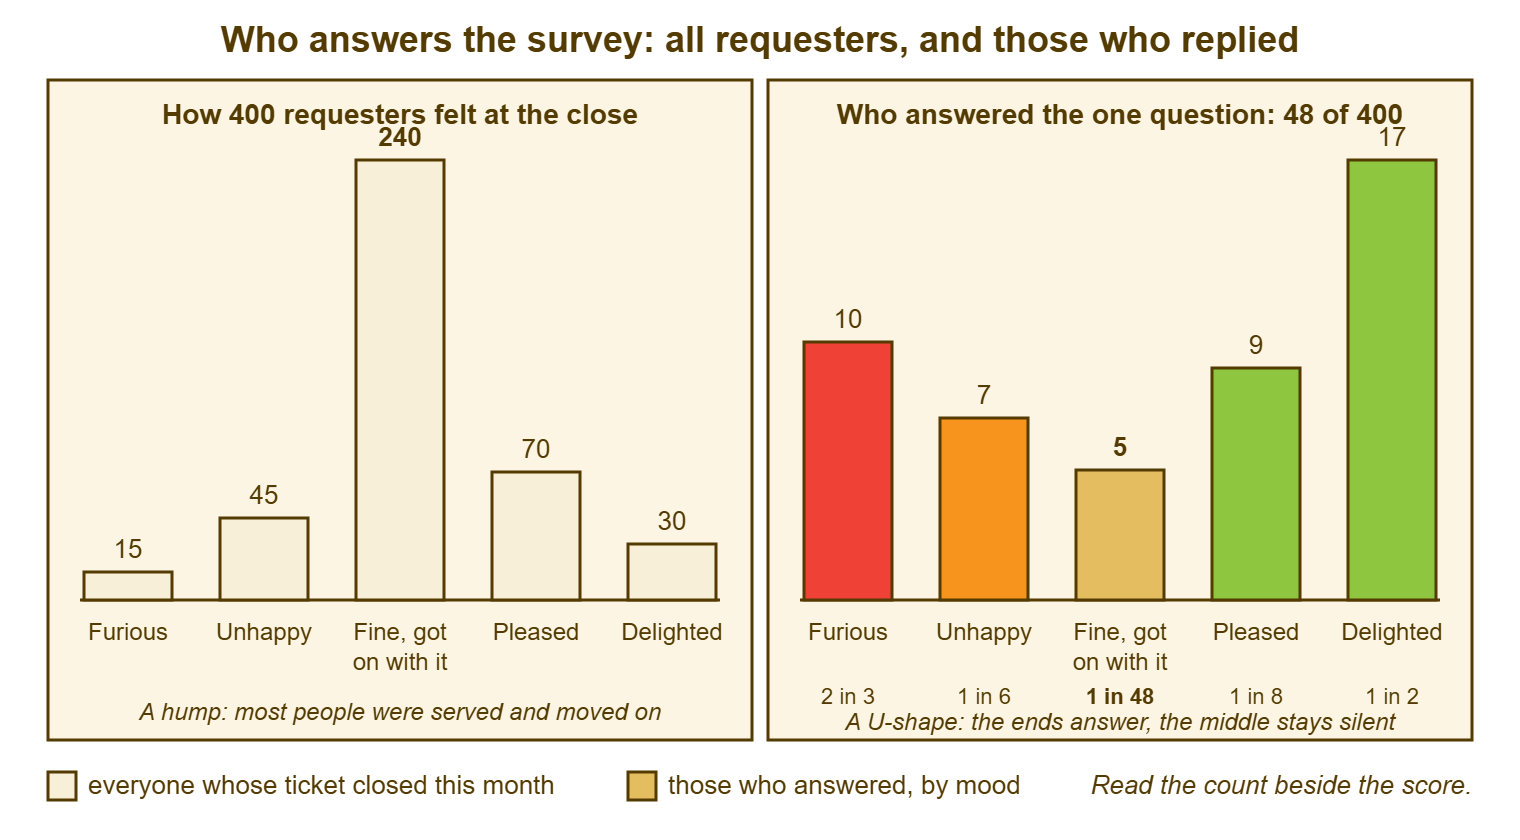
Read the row of shares under the right-hand chart, because that is the mechanism. Two in three of the furious answered. One in two of the delighted answered. One in forty-eight of the people who thought it was fine answered. The survey is not sampling the month; it is sampling the feelings, and the strongest feelings are at the edges. Nothing about the survey's design caused this, and no design fixes it. A shorter question and a one-click answer, as described in Surveys People Actually Answer, raise the share of the middle who bother, from one in forty-eight to perhaps one in twenty. That helps. It does not make the middle loud. The middle is quiet by nature, and the desk reads the survey knowing that.
The silent middle also explains why a desk's score and its reputation can diverge. The score is built from the ends. The reputation is built from the middle, from two hundred and forty people who each say "IT? They're fine" in the kitchen. If the score and the corridor disagree, the corridor is the larger sample.
The Small-Numbers Problem
The second problem is that a small desk gets few answers, and a few answers cannot carry a percentage. The arithmetic is plain. With nine answers, each one is worth eleven percentage points. So a single person moves the figure from 78 to 89 or from 78 to 67. With thirty answers, each one is worth about three points. With a hundred, one point. A desk closing two hundred tickets a month with a one-in-ten response rate has twenty answers. Twenty answers means every click is five points of the headline. And two bad keyboards are a crisis.
Dashboards have no sense of humour about this. A charting tool will draw a line through nine points as confidently as through nine hundred, give it the same thickness, and colour it red when it dips. The reader, who sees the line and not the count, reacts to the line. That is how a keyboard with the wrong layout becomes a message from the head of operations at half past eight. It is also why the first rule of reporting satisfaction is to print the count in the same type size as the score, on the same line, every time. A percentage with a denominator under ten is a costume.
Small numbers also hide trends as readily as they invent them. A desk that has genuinely improved by five points will not see it in a month of twenty answers. Five points is one person, and that person could as easily have been having a bad day. The improvement is real and invisible. The dip is unreal and visible. The cure is the same in both directions: more answers per figure, which means longer periods. It also requires a reading habit that treats any movement inside the noise as nothing until it persists.
The Month With Nine Responses
Here is Yusuf's August in full, every figure from the fictional desk. June: 262 tickets closed with a reply, 54 answers, 46 good, 85 percent. July: 248 closes with a reply, 48 answers, 40 good, 83 percent. August: 210 closes with a reply, 9 answers, 7 good, 1 okay, 1 poor, 78 percent. September, when everyone was back: 271 closes with a reply, 52 answers, 44 good, 85 percent. The chart, left to itself, shows a dip in August and a recovery in September. And a reader who did not look at the counts would conclude that something went wrong in the summer and was fixed.
Nothing went wrong and nothing was fixed. The August response count fell because the people who usually answer were on leave. And the few who were left were covering two jobs and answering nothing. Of the nine who did, one had a keyboard problem, and that one person was eleven points of the headline. Had the keyboard been right, August would have read 89 percent, the best month of the year. In that case, the message from the head of operations would have said "well done". That would have been wrong too. The honest statement for August is nine words long: "seven of nine answers were good; too few to read."
Yusuf's reply to the head of operations was two sentences and a number: "Nine people answered in August against about fifty in a normal month, so the figure is one keyboard's worth of noise; the quarter reads 93 of 111 good, which is where it has been all year." That reply does three things. It names the count. It names the one real event. And it moves the reader to a period with enough answers to carry a figure. It took four minutes to write and it was the end of the conversation. (I once presented a month-on-month rise of eleven points to a director with some pride. The following month I presented a fall of fourteen with some discomfort. Nothing had happened in either month except arithmetic.)
How Many Answers Before You Read a Number
Set a minimum response count below which no percentage is quoted, write it on the definition card, and hold to it. The figures that follow are the fictional desks' rules of thumb, not standards. And the right numbers for your desk depend on how much the score will be asked to carry. Below about ten answers, report in words and counts only: "seven of nine", never 78 percent. Between ten and about thirty, quote a share but label it as indicative and show the quarter beside it. From about thirty answers upward, a monthly share can be read as a figure. Understand that it will still wobble by several points for no reason. For anything cut finer than the whole desk, by category, by team or by technician, the thresholds apply to each slice separately. The arithmetic of that is in Satisfaction by Category, and Carefully by Agent.
When a month is below the threshold, roll up. The quarter has three times the answers; the half year six times. A desk closing sixty tickets a month with six answers has a quarterly count of eighteen and a half-yearly count of thirty-six. The half year is the first period that can honestly carry a percentage. That is slower feedback than anyone wants. It is the feedback the desk's volume can honestly support. The alternative is a monthly figure that lies. The quarterly rhythm for reporting trends rather than months is described in The Quarterly Review. Satisfaction at a small desk is the strongest argument for it.
Expect the wobble and say so in advance. At the fictional desks in this series, a month of around thirty answers swings by ten points or so with no change in service at all, purely from who happened to click. Tell the readers of the report that in the first month, before the first swing, so that when the swing comes it is expected rather than alarming. A desk lead who has said "this figure will move by ten points on its own; a real change is one that holds for a quarter" has bought themselves every August that follows.
Remember: the people who answer are the delighted and the furious, and there are few of them. Never quote a percentage without its count. Never read a month below your minimum count as anything but words. Treat any movement inside the normal wobble as nothing until it persists for a quarter.
The Bias the Desk Adds Itself
Self-selection is the bias nature supplies. The desk supplies several of its own, and they are the ones you can remove. The largest is the silent close. Where the survey rides on the resolving reply, a ticket closed without one is a ticket never asked. The tickets that get closed silently are not random: they are the ones the technician was unsure of, embarrassed by, or finishing at ten to five. The sample is therefore selected for the tickets somebody felt good enough about to write up, before the requester has even chosen whether to click. The remedy is in Avoiding the Silent Close. And it is the single most effective thing a desk can do about its satisfaction figure. That is because it widens the sample without touching the survey.
The second desk-made bias is the request for a rating. Suppose a technician says "if you could give us a good score, that would really help" at the end of a call, or writes it into the reply. That technician is not measuring satisfaction; they are collecting favours. The scores that result are high and worthless. The practice spreads, because once one technician's figures rise the others ask how. Ban it on the first day, in writing, and say why: the desk wants to know how it did, not how kind the requesters are. The broader problem of metrics shaping behaviour, and how to blunt it, is in Metric Gaming and Its Cures.
The third is selective closing. If the hard tickets are closed with a curt line and the easy ones with a warm paragraph, the warm paragraphs get the clicks. In that case, the score describes the easy tickets. If one technician closes everything with a full reply and another closes nothing with one, the desk's score is mostly the first technician's score. None of this requires bad faith. It requires only that people behave naturally. And the cure is a closing habit that is the same for every ticket. That way, the survey reaches the hard ones as reliably as the easy ones. The table below collects the biases, how each shows up, and how to read around it.
| Bias | How it shows in the figures | How to read around it |
|---|---|---|
| Self-selection: the ends answer, the middle does not | Answers cluster at the top and bottom labels; few in the middle | Report the count at each label; read comments; treat the score as a signal from the edges |
| Silent closes: tickets never asked | Response rate falls when closes rise; the asked count is well below the close count | Print asked and closed beside the score; fix the closing habit before the survey |
| Small counts | Monthly figure swings by ten points or more; dips and peaks line up with holidays | Minimum count on the card; roll up to the quarter; words not percentages below the minimum |
| Department culture | One team answers everything, another nothing; the score is really one department's | Show response rate by department; weight nothing, but say whose voice the score is |
| Requests for a rating | One technician's share jumps; comments say "as asked" or thank the technician by name only | Ban the practice in writing; read that technician's comments; discount the month |
| Timing of the ask | Late surveys draw "don't remember"; immediate ones draw reactions to the reply's tone | Fix the moment on the card; never mix surveys asked at different moments in one figure |
| Scores for the policy, not the desk | Low scores with comments about rules, approvals or suppliers | Tag them; count them separately; send the pattern to the policy owner |
Non-Response Is Information
The people who did not answer are not a blank. Their silence has a shape, and the shape is worth a line in the report. Compare the response rate by department. If finance answers one ticket in five and the warehouse answers one in sixty, the score is finance's opinion of the desk. In that case, a warehouse problem will never appear in the score. Compare by channel. Requesters who raise tickets by e-mail often answer more readily than those who phone, because the e-mail requesters already live in their inbox. Compare by ticket type. Password resets draw clicks because they are quick and the gratitude is fresh. A hardware repair that took a fortnight draws fewer, because the requester has stopped caring by the time the reply arrives.
Do not weight the answers to correct for this. Weighting means counting one warehouse answer as if it were three. It produces a figure that looks more representative and is in fact a guess dressed as a measurement. The first manager who asks how it was calculated will not like the answer. Instead, report who the score is from: "the score this quarter is drawn mostly from head office and finance; the warehouse answered six times." That is honest. It tells the reader where the blind spot is. And it leads to the right action, which is going to the warehouse and asking in person. The last article in this series, Beyond the Score, is about doing exactly that.
Reading Comments Over Scores
Read every comment before you read any number. A score tells you how someone felt. A comment tells you what happened. What happened is the only thing the desk can change. Nine comments in a month will contain, reliably, two about speed and two about a specific technician by name. There will be one about a policy the desk does not own, one about the portal, one "thanks", and two that make no sense until you open the ticket. At that point they make perfect sense. That is a month's worth of actual information, and it is in the comments, not in the 78 percent.
Comments also correct the bias in a way numbers cannot. A furious comment that turns out to be about a supplier's delay tells you that the low score is not the desk's. A delighted comment that says "Sam came up straight away" tells you what delighted looks like and who is producing it. Read the comments with the ticket open. That is because the comment is about the ticket and the ticket has the whole story. It shows how long it waited, who touched it, and what the resolving reply actually said. The practice of following up on each low score within a day, and what to say when you do, is in Acting on the Feedback. Here the point is that comments are the signal and the score is the alarm that tells you a signal exists.
Keep a simple tally of comment themes, by hand if you must, because the themes are the trend the score cannot show. "Speed" appearing in six comments out of nine over three months is a finding, whatever the score did. "Had to explain it twice" appearing twice in a quarter after never appearing before is a finding. The tally does not need a tool. It needs someone who reads the comments and writes a word beside each one. And the words become a table at the end of the quarter that says more than any chart.
Reading Around It: Report the Shape, Not the Point
Report the distribution, not the average. "Forty-four good, five okay, three poor, from fifty-two answers and 271 tickets asked" tells the reader everything: how many answered, how they split, how many were asked. An average of 4.5 tells them nothing they can check. The share of good answers can sit on top as the headline, with the count beside it. But the counts at each label stay in the report. The three poor answers are three people with three stories. A reader who can see them will ask what the stories were. That is the right question. The same argument against averages, made for resolution time, is in Median and Percentiles, Not Averages. And it applies here with more force, because the labels were never numbers to begin with.
Report periods long enough to carry the figure, and say which period you are using. A desk that reports quarterly shares with monthly counts in a small table beneath them is reporting honestly. A desk that reports monthly percentages with no counts is reporting weather. Where a chart is wanted, draw the quarterly share as the line and the monthly counts as bars below it. That way, a reader can see at a glance when a month was too thin to mean anything. Charts That Help and Charts That Hide has the mechanics. Never put a monthly satisfaction percentage on a chart with a denominator under your minimum. Not with a footnote. Not "for trend purposes".
Say who the score describes, every time, in one sentence. "Fifty-two people answered, mostly from head office, mostly about quick tickets; the warehouse and the long repairs are under-represented." That sentence is the antidote to every misreading in this article, and it costs twenty seconds. If you run QuerySolv, satisfaction appears in the standard reports alongside the volume and response-time figures. The habit to build is the same there as anywhere. Find the count before you read the score. Write the sentence about who is in it before anyone else writes a sentence about what it means.
A Short War Story: The Recovery Programme at Redbrook Engineering
At Redbrook Engineering, a desk lead called Carl saw the monthly satisfaction average fall from 4.7 to 3.9 in a single month. Without looking at the count, Carl launched a "service recovery programme" the following week. It included a daily stand-up on satisfaction and a set of scripted courtesy lines for the resolving reply. And a technician called Dev was taken off the queue for half of every day. Dev was to telephone each requester after their ticket closed and ask whether everything was all right. The next month the average was 4.8. The programme was credited in the operations meeting and made permanent. Over the following quarter Dev spent roughly a hundred and twenty hours on calls that most requesters found puzzling and several found irritating. The queue aged because the desk was a half-person short. Two comments arrived asking the desk to please stop ringing people. When Carl finally pulled the counts, the 3.9 month had rested on eleven answers. Two of them were from one requester whose laptop had been reimaged wrongly twice. The 4.8 month had rested on thirteen answers from a different eleven people. The two months were two answers apart and the service had been identical throughout. The programme was quietly ended. The hundred and twenty hours were not recovered. Carl now prints the count in bold. Before you fix a number, count the people behind it.
The Bias Checklist
The checklist below is run before any satisfaction figure leaves the desk. That includes figures in a monthly report, a quarterly review or a reply to a worried message at half past eight. It takes five minutes with the report open, and it stops the three most common misreadings. These are the thin month read as a trend, the selected sample read as the population, and the average read as a measurement. Keep a copy pinned beside the definition card. When a figure fails a line, do not send it; send the words instead.
BEFORE THE SCORE LEAVES THE DESK — BIAS CHECKLIST

THE COUNT
  [ ] Responses this period: ______   Tickets asked: ______   Tickets closed: ______
  [ ] Response count is at or above the minimum on the definition card (______)
  [ ] If below the minimum: the figure is given in words and counts, not as a percentage
  [ ] The period is long enough to carry the figure (month / quarter / half year)

THE SHAPE
  [ ] Count at each label is in the report, not just the headline share
  [ ] The headline is the share of good answers, with the count beside it
  [ ] Any average is shown only on request, and only with its count
  [ ] Movement since last period is compared with the normal wobble (______ points)

WHO IS IN IT
  [ ] Response rate by department is known; the loudest and quietest are named
  [ ] Silent closes this period: ______ (tickets that never saw the question)
  [ ] No technician has asked a requester for a rating this period
  [ ] One sentence says whose voice the score mostly is

THE COMMENTS
  [ ] Every comment has been read with its ticket open
  [ ] Each comment has a one-word theme beside it
  [ ] Low scores about policy, suppliers or approvals are counted separately
  [ ] Every low score has been followed up by a person within one working day

THE SENTENCE
  [ ] The report says, in one line, who answered and who did not
  [ ] Nothing in the report invites a reader to act on a movement inside the wobble
Yusuf ran the checklist on the August figure the morning the message arrived. The figure failed on the first section, which is what the checklist is for. The August line in the report now reads, in full: "Nine answers from 210 asked; seven good, one okay, one poor (keyboard, wrong layout, replaced); too few to read; quarter at 93 of 111 good." The head of operations read it and asked no further questions. Nobody has asked what happened in August since, because the report already says. What it says is that nine people answered.
Frequently Asked Questions
If the sample is biased, is the score worth collecting at all?
Can we fix the bias by making the survey compulsory or by chasing the silent middle?
Should we exclude the furious outlier from the month's figure?
How do I explain the small-numbers problem to a manager who wants a monthly percentage?
Is a low response rate itself a sign of dissatisfaction?
What minimum response count should we put on the definition card?
From the QuerySolv team: we build self-hosted help desk software for Windows. QuerySolv runs as one Windows service on your own network. It takes requests by web form, e-mail, live chat, social messages and REST API. It is licensed once per installation rather than per agent per month. The free trial runs the full product for 30 days.