
Median and Percentiles, Not Averages: Reading Resolution Time
Tuesday, 14:20, at Redbrook Engineering. Tomasz runs the desk for a design office of ninety people, with two technicians. The quarterly report asks, in a box he did not design, for "average resolution time". Last month the desk resolved twenty tickets. The spreadsheet says the average was 37.3 business hours, which is nearly five working days. Tomasz knows the desk is faster than that; he was there. He sorts the twenty by resolution time and reads down the list. Nineteen of them were resolved inside forty-five hours and most inside a working day. The twentieth, ticket 5118, was a drawing-software licence transfer that sat with the vendor for seventy working days before anyone at the vendor could find the contract. Take 5118 out and the average is 9.8 hours. He cannot take it out, because it happened. He looks instead at the ticket in the middle of the sorted list, which took five and a half hours. He notices that it does not care whether 5118 took fifty-six hours or five hundred and sixty.
The average, which statisticians call the mean, is every resolution time added up and divided by the number of tickets. The median is the resolution time of the middle ticket when all of them are sorted from fastest to slowest. A percentile is the resolution time below which a given share of tickets fall, and the 90th percentile is the time within which nine tickets in ten were resolved. The average is what spreadsheets and reports offer first, and for resolution time it is the wrong number almost every month. The reason has nothing to do with statistics and everything to do with the one ticket that waited for a vendor. This article is part of our Time to Resolution series. It is about replacing the average with two numbers that describe the desk instead of the vendor.
It covers why the average lies and the one case where it is still useful, then the median and what it does and does not tell you. Next come the 90th percentile as the tail in one number, and the worked example of twenty tickets at a fictional desk, with a picture. Then come the spreadsheet formula in plain words, what to do when the numbers are small, and what the reported sentence sounds like. A short war story and the percentile worksheet to copy finish the article, in that order. Every number is from the fictional desk and is an example, not a standard.
Why the Average Lies
The average answers a question nobody asked. It says: if all the resolution time in the month were pooled and shared out equally between the tickets, how much would each get? No requester experiences that. No technician does either. The claims handler whose ticket took an hour and the engineer whose licence took a quarter did not meet in the middle. A number that says they did is describing an event that never happened to anyone. It is a perfectly good number for some things, which we will come to, and it is a poor description of what a desk is like to deal with.
The mechanism is that the average is pulled by size, not by count. One ticket of five hundred and sixty hours moves the average by exactly as much as a hundred tickets of five and a half hours would. The average only sees the total. On a desk with twenty tickets a month, one vendor dispute, one part on back order or one ticket forgotten under someone's leave is enough to double the figure. These happen most months on most desks. The average therefore does not measure the desk; it measures whichever ticket was slowest, with the other nineteen as a rounding error. (It is a measurement of your supplier's contract department, with your name on it.)
The average also punishes the desk for doing the right thing. A desk that finally resolves a ticket that has been open for four months sees that month's average leap, on the day the ticket stops being a problem. A desk that clears forty old tickets in a dig-out, which is the correct response to a backlog, posts its worst average of the year in the same month and its best month for requesters. The war story at the end of this article is that month. A number that goes up when the desk improves is not a performance measure; it is a trap with a chart attached.
There is one honest use for the average, and it should be kept for that. The average times the number of tickets is the total. That is the total hours of elapsed time, or, if you have measured it, the total hours of technician effort. Totals are what capacity and cost arithmetic need. The economics of the desk, including the traps in dividing cost by tickets, are the subject of Cost per Ticket and Its Traps. Keep the average for that sum and keep it off the chart that describes how long people wait.
The Median: The Ticket in the Middle
The median is found by sorting, not by adding. Sort every resolved ticket in the month from the fastest to the slowest and take the one in the middle. With an even count, take the point halfway between the two middle ones. That is the whole method, and a junior technician can do it on paper with twenty tickets in two minutes, which is the first thing to recommend it. The median of Redbrook's twenty was halfway between the tenth ticket, at five hours, and the eleventh, at six: five and a half business hours.
The median describes the typical requester's experience, which is what most people mean when they ask how long things take. Half the tickets were resolved faster than the median and half slower, so a requester raising a ticket has an even chance of being done within it. The median moves when the desk's ordinary tickets get faster or slower, and it does not move when one ticket goes to the vendor for a quarter. Ticket 5118 could have taken fifty-six hours, five hundred and sixty, or five thousand. The median of the twenty would have been five and a half hours in every case. That is because 5118 was the slowest ticket in all three and the middle of the list did not notice.
What the median hides is the tail. A desk with a median of five hours reports the same median as another desk where the median is five hours but one ticket in ten takes a month. The requesters at the second desk know the difference. The median is silent about everything above it; it says where the middle is and nothing about how far away the far end has got. That is why the median never travels alone, and why the second number exists.
The 90th Percentile: The Tail in One Number
The 90th percentile is the resolution time within which nine tickets in ten were resolved, and it is found from the same sorted list. Count the tickets, multiply by nine tenths, round up, and take the ticket at that position. With twenty tickets, nine tenths is eighteen, so the eighteenth ticket from the fastest end is the 90th percentile. At Redbrook that was ticket 6152, a site printer waiting on a part, at thirty-one business hours. Nine in ten of the month's requesters were done within thirty-one hours; one in ten waited longer, and the figure says how long "longer" starts.
The 90th percentile is the number for the unlucky tenth, and the unlucky tenth is who complains. Nobody raises a concern about the median ticket. The people who find the desk slow are the ones in the tail. The 90th percentile tells you how slow the tail begins without being captured by the single slowest ticket the way the average is. If the slowest ticket had taken a year the 90th percentile would still be thirty-one hours, because the eighteenth ticket is the eighteenth ticket whatever the twentieth does. The gap between the median and the 90th percentile is the length of the tail. A desk that watches that gap month to month knows more about itself than one that watches any single figure.
Why not simply report the slowest ticket? Because the slowest ticket is one ticket, and one ticket is an anecdote with a timestamp. It is worth reading, along with the nine behind it, and that reading is the subject of Outlier Analysis: The Ten Slowest Tickets, but it is not a measure of the desk. And why the 90th rather than the 95th or 99th? On a desk with twenty tickets a month, the 95th percentile is the nineteenth ticket and the 99th is the twentieth. So both are the slowest ticket or next to it, and the anecdote problem is back. The 90th is far enough into the tail to see it and not so far that one ticket decides it. On very small desks, under thirty tickets a month, the 75th percentile is steadier still. The honest move is to roll three months together before reading any percentile at all.
Together the median and the 90th percentile describe the shape of the month. "Half within five and a half hours, nine in ten within thirty-one" tells a reader what a normal ticket is like and what a bad one is like, in two numbers that each ignore the single worst case. The general idea of reading metrics as pairs rather than one at a time is set out in Reading Metrics Together. The median and the 90th percentile are the first such pair for this metric. The pair that referees speed against quality comes later in this series.
The Worked Example: Twenty Tickets at Redbrook
Here are Redbrook's twenty resolved tickets for the month, sorted. The resolution time is in business hours from created to resolved, with no pauses, as the desk's definition card specifies. Read down the hours column and notice where the numbers start to stretch. They rise steadily through the first fifteen. Then comes a jump at the laptop that waited for delivery, two part orders, and then 5118. The sum of all twenty is 746.1 hours. Divided by twenty that is 37.3 hours, the average Tomasz could not believe. The tenth and eleventh tickets give a median of 5.5 hours. The eighteenth ticket gives a 90th percentile of 31 hours.
| Rank | Ticket | What it was | Business hours |
|---|---|---|---|
| 1 | 6102 | Account unlock | 0.3 |
| 2 | 6107 | Stuck print queue cleared | 0.5 |
| 3 | 6111 | Shared drive mapped | 0.8 |
| 4 | 6114 | Mailbox permission granted | 1.0 |
| 5 | 6118 | Plotter driver reinstalled | 1.5 |
| 6 | 6121 | Licence seat moved to a new user | 2.0 |
| 7 | 6123 | Laptop would not wake from sleep | 2.5 |
| 8 | 6126 | VPN client reinstalled | 3.0 |
| 9 | 6130 | New starter account and groups | 4.0 |
| 10 | 6133 | Calendar sharing between two teams | 5.0 |
| 11 | 6135 | Corrupt drawing file restored from backup | 6.0 |
| 12 | 6138 | Monitor replaced from stock | 7.5 |
| 13 | 6140 | Project folder permissions reworked | 9.0 |
| 14 | 6142 | Desk phone replaced | 11.0 |
| 15 | 6145 | Laptop rebuilt after disk failure | 14.0 |
| 16 | 6147 | Scanner-to-e-mail set up on new copier | 18.0 |
| 17 | 6150 | New laptop set up, waited on delivery | 24.0 |
| 18 | 6152 | Site printer, part ordered | 31.0 |
| 19 | 6155 | Workstation graphics card, part ordered | 45.0 |
| 20 | 5118 | Licence transfer, waiting on the vendor | 560.0 |
The picture below lays the same twenty tickets on a ruler of hours, and it shows at a glance what the table shows on reflection. Nineteen tickets are crowded into the left-hand part of the ruler, most of them in the first ten hours. The median line sits inside that crowd, where the typical ticket is. The 90th percentile line sits at the edge of the crowd, where the tail begins. The average line sits to the right of eighteen of the twenty tickets, in a region where almost nothing happened. One ticket far past the break in the ruler has dragged it there. The dashed line shows where the average would be without that ticket: under ten hours, inside the crowd, close to where a reader would have guessed.
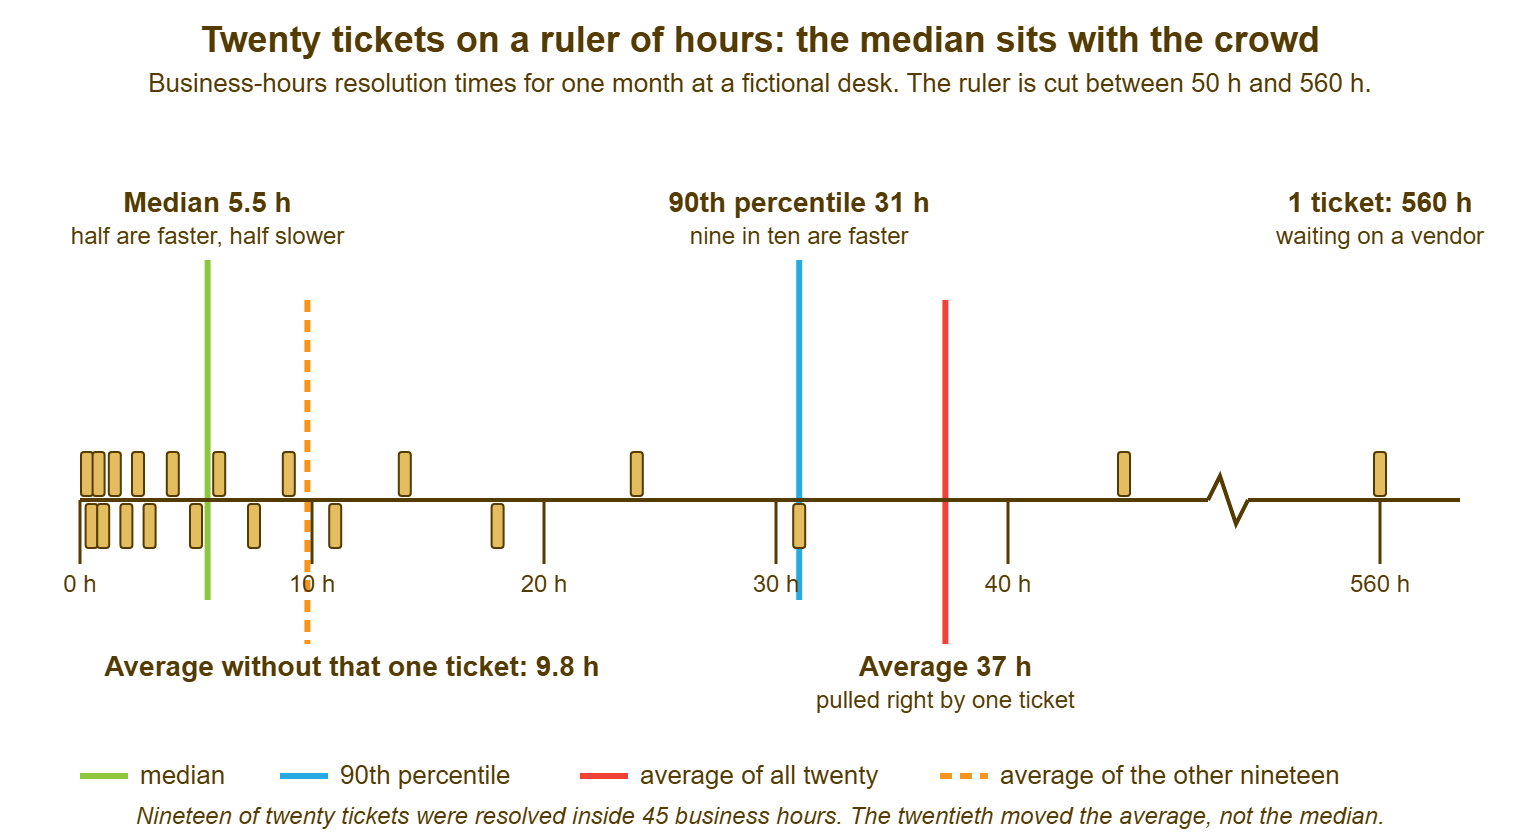
Now try the experiment Tomasz tried, but on paper. If ticket 5118 had taken fifty-six hours instead of five hundred and sixty, the average would have been 12.1 hours, a third of what was reported. The median and the 90th percentile would both have been exactly what they were, because 5118 would still have been the twentieth ticket. Suppose the desk had instead had a bad week and every one of the first ten tickets had taken an hour longer. The average would have risen by half an hour, the median by one hour, and the 90th percentile not at all. The median moved for the thing that happened to ordinary tickets. The average moved for the thing that happened to the vendor. That is the whole case, and twenty tickets are enough to make it.
The Spreadsheet Formula in Plain Words
The arithmetic is one export and three functions. Once a month, export the tickets whose resolved stamp falls in the month, with the created stamp, the resolved stamp and the resolution time in business hours. Most tools provide that time as a column. Or the spreadsheet can compute it from the two stamps with its working-hours function. Remove the tickets that closed without a resolution, as the definition card from What Time to Resolution Actually Measures lists them. What remains is one column of hours, and everything else is a function applied to that column.
The median is the median function applied to the hours column; every spreadsheet has one and it takes the range and nothing else. The 90th percentile is the percentile function applied to the same column with nine tenths as the second argument. The count is the count of the column, and it goes on the report next to every figure. A median of eight tickets and a median of eighty are different kinds of fact. The average, if the report demands it, is the average function, and it goes on the total-hours line and nowhere else. If you run QuerySolv, the standard reports already cover response and resolution times. Whichever tool you run, export the list and compute the median yourself at least once. That way you know the report's definition matches your card before you trust its figure.
Percentiles come in slightly different flavours, and this matters only enough to say which one you used. The by-hand method above, sort and take the position, gives thirty-one hours for Redbrook. Most spreadsheet percentile functions interpolate between the two nearest positions instead and give about thirty-two for the same list. The difference is small, and it is never worth arguing about. It is worth one line on the worksheet. Next year's desk lead, finding thirty-one in one place and thirty-two in another, should not spend an afternoon hunting a bug that is not there. Do the by-hand version once, compare it with the function, and then let the function do it.
Two mistakes are common enough to name. The first is counting by created month instead of resolved month. A ticket created in March and resolved in May has a resolution time. It belongs to May's figures, because May is when the desk resolved it. Ticket 5118 was created in the previous quarter and it belongs to the month it was finally done. The second is letting open tickets into the column by using today's date as a stand-in for the resolved stamp. That produces a figure that falls every time anything is closed and rises overnight. Open tickets have an age and no resolution time, and age belongs on the backlog report, which Reading an Aging Report explains. A one-second sanity check catches both. The median must sit between the tenth and eleventh values of the sorted list, or whatever the middle positions are for your count. If it does not, something is in the wrong column.
Small Numbers: When Twenty Is Too Few
Twenty tickets is enough to show why the median beats the average, and it is not many to build a trend on. The median of twenty moves when two tickets change places. The 90th percentile of twenty is one ticket, the eighteenth. A quiet month with eight tickets has no 90th percentile worth printing at all. The eighth ticket of eight is the slowest ticket, and the anecdote is back. The honest moves are to print the count beside every figure, and to roll three months together for any desk resolving under about thirty tickets a month. Mark a figure built on fewer than that as a small sample in the report, in words, every time.
Cutting the figure by technician multiplies the small-number problem by the number of technicians, and it adds a human one. A desk of three resolving sixty tickets a month has twenty per person, and twenty is exactly the sample we have just said is thin. The rule for per-person figures in this series is firm: they are for coaching, not ranking. They are medians, never averages, because one vendor ticket on one technician's list would otherwise make that technician look slow for a quarter. The desk sets a minimum sample before any per-person figure is read at all. Thirty resolved tickets per person is a reasonable one. Even then the figure is a prompt for a conversation about which tickets were slow and why, not a score. The ways a visible per-person number changes behaviour, usually for the worse, are the subject of Dashboards That Motivate Instead of Surveil.
The temptation with small numbers is to drop the slow ticket "because it is not representative". The answer is that it is representative of something, and that something is the point of reading it. Leave 5118 in the list; it is in the median's list without affecting the median, which is precisely the median's virtue. Then read it, in the tail review, and find out why a licence transfer took a quarter. Deleting it from the sum teaches the desk nothing. Deleting it from the sum and reporting the average is how a desk arrives at a number it cannot defend when the one requester who waited a quarter asks about it.
What the Reported Sentence Sounds Like
The report of a month's resolution time is one sentence with two numbers, a count, and the slowest ticket named: "Half of the twenty tickets resolved in the month were done within five and a half business hours, nine in ten within thirty-one, and one, a licence transfer that waited on the vendor for seventy working days, is explained in the tail review." It is longer than "average resolution time: 37.3 hours" and it is the sentence Tomasz sent, because it describes a desk a reader can picture. The reader, having pictured it, does not then ask why the desk takes a week to fix things. The chart that goes with it is a bar for the median and a bar for the 90th percentile, month by month, with the count written under each pair. The charts that help and the ones that hide are compared in Charts That Help and Charts That Hide.
Never report the average alone. Not in the executive summary, not in the box on the quarterly template, not "just this once because that is what they asked for". If a form insists on an average, give it, and write the median beside it with the words "median, which describes the typical ticket", and the sentence about the slow one underneath. A reader who sees 37.3 and 5.5 side by side will ask what the difference is. The answer to that question is the most useful thing the desk will say about itself all quarter. A reader who sees 37.3 alone will believe it, and then act on it.
Remember: report the median as the typical ticket and the 90th percentile as the tail, with the count beside both. Keep the average for the total-hours line and nowhere else, and never let a slow ticket out of the list; read it instead.
When the median and the 90th percentile disagree about the month, say so, because the disagreement is information. A month where the median fell and the 90th percentile rose is a desk that got faster at ordinary tickets while something made the slow ones slower. That usually means a supplier, a leave period or a new system that only some tickets touch. A month where both rose is a desk under load. A month where the median held and the 90th percentile fell is the best kind of month and the one most often missed. The single figure most reports carry, the average, is quite capable of rising while it happens. Two numbers can tell a story. One number can only tell a size.
A Short War Story: The Month the Backlog Was Cleared at Bluewater Bank
At Bluewater Bank, the desk lead, Ines, inherited a backlog of about forty tickets that had been open for between three and nine months. Most were reporting requests and access changes nobody had chased. She spent the first month of her tenure clearing them properly, with a reply to every requester and a resolution on every ticket. That was exactly what the backlog recovery guidance says to do. The monthly report, which carried a single figure for average resolution time, went from eleven business hours to one hundred and ninety. It went to the chief operating officer before Ines saw it, with a comment from her own manager that the new lead was "finding her feet". A request to recruit a second technician, which had been agreed in principle, was paused "until the desk's performance recovers". Ines spent most of a week rebuilding three months of reports with the median and the 90th percentile. They showed that the median had fallen from eight hours to six in the same month the average had gone through the ceiling. The ordinary tickets had got faster while the forty old ones were being put out of their misery. The recruitment was unpaused a month later than it should have been, which cost the desk roughly a hundred and sixty technician hours it would otherwise have had. A number that rises on the month you fix the backlog is not measuring you, and the time to find that out is before it reaches the chief operating officer.
The Percentile Worksheet
The worksheet below is the monthly arithmetic as a form, one copy per month. Section A builds the list from the definition card. Section B is the by-hand version, which is worth doing in full the first month and spot-checking after that. A desk lead who has sorted twenty tickets by hand once will never again be fooled by an average. Section C is the spreadsheet, section D is the trend, section E is the sentence, and section F is the check that stops the figure leaving the desk with a hole in it. Keep the completed sheets in the same folder as the definition card; three of them in a row are the first trend the desk has ever had.
PERCENTILE WORKSHEET — ONE MONTH, ONE PAGE
Desk: ______________________   Month: __________   Prepared by: ______________   Definition card version: ____

A. THE LIST
   A1 Tickets with a resolved stamp in the month ............................ ____
   A2 Removed: closed without a resolution (duplicate, spam, withdrawn) ..... ____
   A3 Tickets in the sum (A1 minus A2) ...................................... ____   this is n
   A4 Clock used: business hours [ ]  calendar [ ]     Stop stamp: resolved [ ]
   A5 Open tickets excluded (they have an age, not a resolution time) ....... [ ]

B. BY HAND (in full the first month; a spot check after that)
   B1 Sort the hours column from fastest to slowest
   B2 Median: odd n, the middle value; even n, halfway between the two middle values .... ____ h
   B3 90th percentile: n times nine tenths, rounded up, the value at that position ....... ____ h
   B4 Slowest ticket (for the tail review, never for the headline) ............ ____ h   ticket ______

C. BY SPREADSHEET
   C1 Median of the hours column ............................................ ____ h
   C2 Percentile of the hours column at nine tenths (method noted: ______________) ... ____ h
   C3 Average of the hours column (total-hours line only) ................... ____ h
   C4 Total elapsed hours (C3 times n) ...................................... ____ h
   C5 B2 equals C1 [ ]     B3 within one position of C2 [ ]

D. THE TREND
                         this month   last month   month before
   n ..................   ______       ______       ______
   Median .............   ______ h     ______ h     ______ h
   90th percentile ....   ______ h     ______ h     ______ h
   Rolling three-month median ______ h   rolling three-month 90th percentile ______ h

E. THE SENTENCE FOR THE REPORT
   "Half of the ____ tickets resolved in __________ were done within ____ business hours,
    nine in ten within ____; the slowest, ticket ______, took ____ and is explained in the tail review."

F. BEFORE THIS LEAVES THE DESK
   [ ] n is written next to every figure
   [ ] the average appears nowhere on its own
   [ ] clock, stop stamp and exclusions match the definition card
   [ ] no open ticket is in the list
   [ ] n under thirty: figures marked "small sample" and the rolling quarter shown beside them
   [ ] the slowest ticket is on the tail review list, not deleted from this one
Tomasz filled in the sheet for the month that afternoon, by hand first, which took eleven minutes including finding a pen. The quarterly template still had its box for the average, so he put 37.3 in it. Beside it, in the margin the template did not have, he wrote "median 5.5 h, 90th percentile 31 h, n = 20; the average is one licence transfer". The finance director who read the template rang him to ask about the licence transfer. It was the first time anyone had rung about a desk report. The next version of the template had a box for the median. The box for the average is still there. It is smaller now.
Frequently Asked Questions
Why not just remove the outliers and report the average of the rest?
Should I use the 90th percentile or the 95th?
How many tickets do I need before the median means anything?
Should the median be in business hours or calendar hours?
My spreadsheet and my ticketing tool give different 90th percentiles. Which is right?
Can I use the median as a service-level target?
From the QuerySolv team: we build self-hosted help desk software for Windows. QuerySolv runs as one Windows service on your own network. It takes requests by web form, e-mail, live chat, social messages and REST API. It is licensed once per installation rather than per agent per month. The free trial runs the full product for 30 days.