
What Time to Resolution Actually Measures
Monday, 09:10, at Stonebridge Insurance. Priya runs a desk of three, and the claims director has forwarded last month's report with one line above it: "Average time to resolution 4.3 days?? We agreed one working day." Priya opens the report and reads the small print, which nobody had read before because it was small. The number runs from the moment a ticket was created to the moment it was closed, in calendar hours, around the clock, weekends included. And it includes the three days the desk leaves a resolved ticket open in case the requester comes back. She picks one ticket from the list to see what that does. Ticket 4471, a claims handler's spreadsheet macro that would not run, was created on Friday at 16:30. It got a reply twenty minutes later asking for a screenshot. It got the screenshot on Monday at 09:00, was fixed by 10:30 and was closed on Thursday. The report calls that 138 hours. The claims handler, if asked, would say it took an hour and a half on Monday morning.
Time to resolution is the time between a request reaching the desk and the desk delivering a fix the requester can use. That is one plain sentence, and it hides four decisions. They are when the clock starts, when it stops, whether it runs overnight, and whether it runs while the ticket is waiting for somebody else. Two desks that make those four decisions differently will report numbers that differ by a factor of ten for identical work. Both will call the number time to resolution. This article is part of our Time to Resolution series, and it is about the four decisions. The aim is that the number you report means the same thing to you, to your director and to yourself in six months.
It covers why one name hides several numbers, then where the clock starts. Next comes where it stops, and why that is resolved rather than closed. We cover what the clock does overnight and at weekends, then what it does while the ticket waits. We explain how resolution time differs from response time, then the four honest numbers one ticket produces, with a picture and a table. We finish with writing the definition down, a short war story, and the definition card to copy.
One Name, Several Numbers
Every help desk tool reports a resolution time, and no two tools define it the same way. Some count calendar time; some count business hours. Some stop at the resolved status and some at closed. Some subtract time in a waiting status and some do not. Some restart the clock when a ticket is reopened and some keep it running from the original creation. None of these is wrong. Each is a reasonable answer to a question the tool's designers asked themselves, and the question was not the one your director is asking. The number arrives on the report with a label and no definition, and the label is doing a great deal of work.
The number without the definition is a rumour. Priya's 4.3 days was true, and so was the claims handler's hour and a half. A report that puts one of them in front of a director without saying which one it is has started an argument that will take a meeting to finish. The cure is not a better number. It is a written definition, agreed once, printed at the bottom of every report that uses it, and re-read whenever anybody is surprised. The general discipline of defining each metric so that two people get the same number is the subject of Defining Each Metric Exactly. This article is that discipline applied to the one metric with the most moving parts.
Before the four decisions, one piece of vocabulary. A timestamp, or stamp, is the date and time the tool records against an event on a ticket: created, first reply, status changed, resolved, closed. Resolution time is always the difference between two stamps, measured on some clock. The four decisions are which two stamps and which clock. Everything below is that.
Where the Clock Starts
The clock starts when the request reaches the desk's system, not when a person first reads it. An e-mail that arrives at 23:40 on Friday creates a ticket at 23:40 on Friday, and that is the start stamp, even though nobody will see it until Monday. This feels unfair to the desk on the night it happens and is the only honest choice, because the requester's wait began when they asked. The desk's own view of when work could reasonably have started is handled by the business-hours decision below, not by moving the start. A desk that starts the clock at first read has a clock that starts whenever it feels like it.
Phone calls and walk-ups are the start-stamp problem in its purest form. A technician takes a call at 10:15, fixes the thing by 10:40, and logs a ticket at 11:30 "so it is on record". That gives a ticket created at 11:30 and resolved at 11:31, with a resolution time of one minute. Fifty of those a month and the desk's median is a lie it told itself by accident. The rule is that a ticket logged after the fact records the real start time, which most tools let you set on creation. Where they do not, it carries a note with the real time so the monthly review can correct it. The triage habit that catches these is in First-Touch Discipline: log it when the phone rings, not when the problem ends.
Two edge cases need a line on the definition card. A ticket that is merged into another takes the earlier created stamp of the two, because the requester has been waiting since the first one. A ticket that is reopened keeps its original created stamp; the clock does not restart just because the desk thought it had finished. Both are small, and both are the kind of thing two technicians will do differently for a year unless somebody writes the answer down.
Where the Clock Stops: Resolved, Not Closed
The clock stops at the resolved stamp: the moment the desk sends the reply that delivers the fix and marks the ticket as resolved. It does not stop at closed, which is the later moment when the requester confirms the fix or a confirmation window runs out without a reply. The difference is the whole of Priya's three days. Resolution is something the desk does. Closure is something that happens to the ticket afterwards, on a timer. Measuring to closure adds a fixed quantity of nothing to every ticket. The two statuses and the window between them are explained in Resolved vs Closed: The Confirmation Window. And the resolution-time clock should respect the distinction even on a desk that otherwise ignores it.
Measuring to closed also hands the number to the requester. A requester who confirms in an hour and one who never replies produce different closure times for the same work. A desk that measures to closed will find its number improving when it shortens the confirmation window. That improves nothing anyone cares about. Measure to resolved, and the number belongs to the desk. (The number will still find ways to misbehave. It just has to work harder.)
The reopen is the one place where "stop at resolved" needs a second sentence. When a requester replies to a resolved ticket to say the fix did not hold, most tools reopen it, and it will be resolved again later. The honest resolution time is from the original created stamp to the final resolved stamp, because the requester's problem was not fixed the first time, whatever the desk believed. Some tools report the first resolved stamp and some the last. Test yours by reopening a resolved ticket and reading the report the next day. The first-resolve version makes a desk that resolves prematurely look fast, which is exactly the desk it should not flatter. The way reopens expose that trick is the subject of Speed Versus Quality.
Tickets that end without a resolution are excluded, and the card names them. A ticket closed as a duplicate, as spam, as withdrawn by the requester, or as "cannot reproduce, requester gone quiet" has no resolution time because nothing was resolved. Counting it would pollute the number in either direction, depending on how quickly the desk tidies. List the closing statuses or reasons that count as "no resolution" on the card and leave them out of every resolution-time figure. If you run QuerySolv, every ticket carries its complete event history. That means each status change, the resolving reply and the original created stamp are all on one list. Checking where a particular ticket's clock began and ended is a matter of reading that list rather than reconstructing it from mail.
What the Clock Does Overnight
Calendar time counts every hour between two stamps, nights and weekends included. Business hours count only the hours the desk is open, on a schedule the desk writes down. For Stonebridge, that is 08:00 to 18:00, Monday to Friday, public holidays excluded. Ticket 4471, created Friday 16:30 and resolved Monday 10:30, took 66 calendar hours and 4 business hours. Neither figure is wrong. The first is what the claims handler lived through, and the second is what the desk could possibly have done about it. And a desk needs both because they answer different questions from different people.
Business hours are the right clock for measuring the desk, because the desk cannot resolve tickets while it is closed and a number that punishes it for the weekend is measuring the calendar. They are also the clock that service-level targets usually run on, so the measurement and the promise agree about what an hour is. Most tools, QuerySolv among them, run service-level targets per priority on a business-hours schedule. And the desk's own reporting should use the same schedule, with the same holidays. Otherwise, the two numbers will drift apart and someone will spend an afternoon finding out why. The targets themselves, and the difference between a response target and a resolution target, belong to Response vs Resolution Targets. This article only insists that the measurement use the same clock as the target.
Calendar time is the right clock for talking to requesters and for the honest half of the leadership report. The claims handler waited from Friday afternoon to Monday morning, and telling her the desk resolved her ticket in four hours is true in a way that will not help. When a director asks how long people wait, the calendar figure is the answer, with the business-hours figure beside it. A sentence explains the gap: "Requesters wait a median of twenty-two calendar hours, of which the desk is open for six; the rest is nights and weekends." That sentence has started more useful conversations about coverage than any coverage proposal, because the gap is visible and nobody has to argue about whose fault it is.
Write the schedule down, including the holidays, and check that the tool's schedule matches it. A desk that reports in business hours against a schedule the tool thinks is 09:00 to 17:00, while the desk actually opens at 08:00, is quietly giving itself an hour a day. Half-days before holidays, the Friday-afternoon early close, and the site that works a different week are all places where the written schedule and the configured one disagree. The disagreement is invisible until somebody reads the stamps on a single ticket and does the arithmetic by hand. Do that once a quarter with one ticket. It takes five minutes.
What the Clock Does While the Ticket Waits
A waiting status is any status whose meaning is "the next step belongs to someone other than the desk". Examples are waiting on the requester for information, waiting on a supplier for a part, and waiting on another team for an approval. Ticket 4471 spent the whole weekend and the first hour of Monday waiting for a screenshot. Whether that time counts toward resolution time is the fourth decision, and it is the one with the most consequences, because it is the one that technicians can influence by changing a status.
Some tools pause the resolution clock in a waiting status, some do not, and some pause it in one waiting status but not another. Test yours: put a test ticket into each waiting status over a weekend and read the resolution time the tool reports on Monday. Whatever the tool does, the desk needs two numbers, not a choice between them. The elapsed resolution time, with no pauses, is what the requester experienced and is the honest headline. The desk time, with the waiting subtracted, is what the desk itself spent and is where the improvement lives. As the last article in this series shows, waiting is usually the largest share of elapsed time and the easiest to shrink. Report the first; keep the second; never let the second quietly become the first.
The reason to keep the elapsed number as the headline is that a pause is an incentive. A clock that stops when the status changes to "waiting on requester" will be stopped, by well-meaning technicians, at ten to six on a Friday, with a question the requester did not need to be asked. Nobody decides to do this. It happens the way water finds the gap in a roof. Within a quarter the reported number has improved and the requesters have not noticed any improvement, because there was none. The war story below is that quarter. If the tool pauses the clock, insist that every waiting status carries a note saying what is awaited and from whom. In that case, read a sample of them each month, which is the discipline described in Pending User vs Pending Vendor vs On Hold.
Waiting time is a finding, not an excuse. When the desk's elapsed median is twenty hours and its desk-time median is three, the seventeen hours of difference is the most useful number on the report. It says where the time is going and points at things the desk can change. These include the question asked on the second contact that should have been asked on the first. They include the supplier with no chase date, and the approval that lives in somebody's inbox. Reporting desk time alone throws that number away in order to look better. Reporting elapsed time alone keeps the number but hides it. Reporting both, side by side, is the only version that lets a desk improve.
Resolution Time Is Not Response Time
Response time is the time from the created stamp to the first human reply, and it is a different measurement of a different thing. A desk can have an excellent response time and a dreadful resolution time: "Thanks, we are looking into it" in four minutes, followed by a fix in four weeks. A desk can also have the reverse, resolving most things inside an hour but never sending an acknowledgement. In that case, the requester spends that hour wondering whether the e-mail arrived. The two numbers measure, respectively, whether the requester was heard and whether the requester was helped. And a report that gives one without the other is describing half a desk.
Keep the first reply human when measuring response time. An automatic "your ticket has been received" is useful and is not a response. It tells the requester the mail server is working, which they did not doubt. Most tools let you exclude automatic replies from the first-response stamp, and if yours does not, the response figure is measuring the mail server's reflexes and will be very good. The choice of targets for each, and why a desk should promise response firmly and resolution carefully, is made in the SLA Design series and is not repeated here.
Two more neighbours are worth naming so that they are not confused with resolution time. Handle time is the number of technician minutes actually spent on the ticket, which most tools do not record and which the desk estimates from a sample when it needs to. Handle time belongs to the economics of the desk rather than to its speed. Age is how long a ticket that is still open has been open. The open ticket has no resolved stamp yet, so it has no resolution time. Age belongs on the backlog report, which What Ticket Age Actually Measures explains. A desk that mixes open tickets into its resolution-time figure, by using today as the stop stamp, has invented a number. That number falls every time it closes anything and rises every time it does not, which is a mood, not a metric.
One Ticket, Four Numbers
The picture below is ticket 4471 drawn as a timeline and then measured four ways, and it is the whole article in one image. The top band is the life of the ticket. It starts with twenty minutes of desk work on Friday afternoon, then a weekend of waiting on the requester. Then come an hour and a half of work on Monday morning, the resolved stamp at 10:30, and the confirmation window until Thursday. The four bars underneath are the four resolution times that one ticket honestly produces, depending on the four decisions. The longest is 138 hours and the shortest is under two, and the ticket did not change between them.
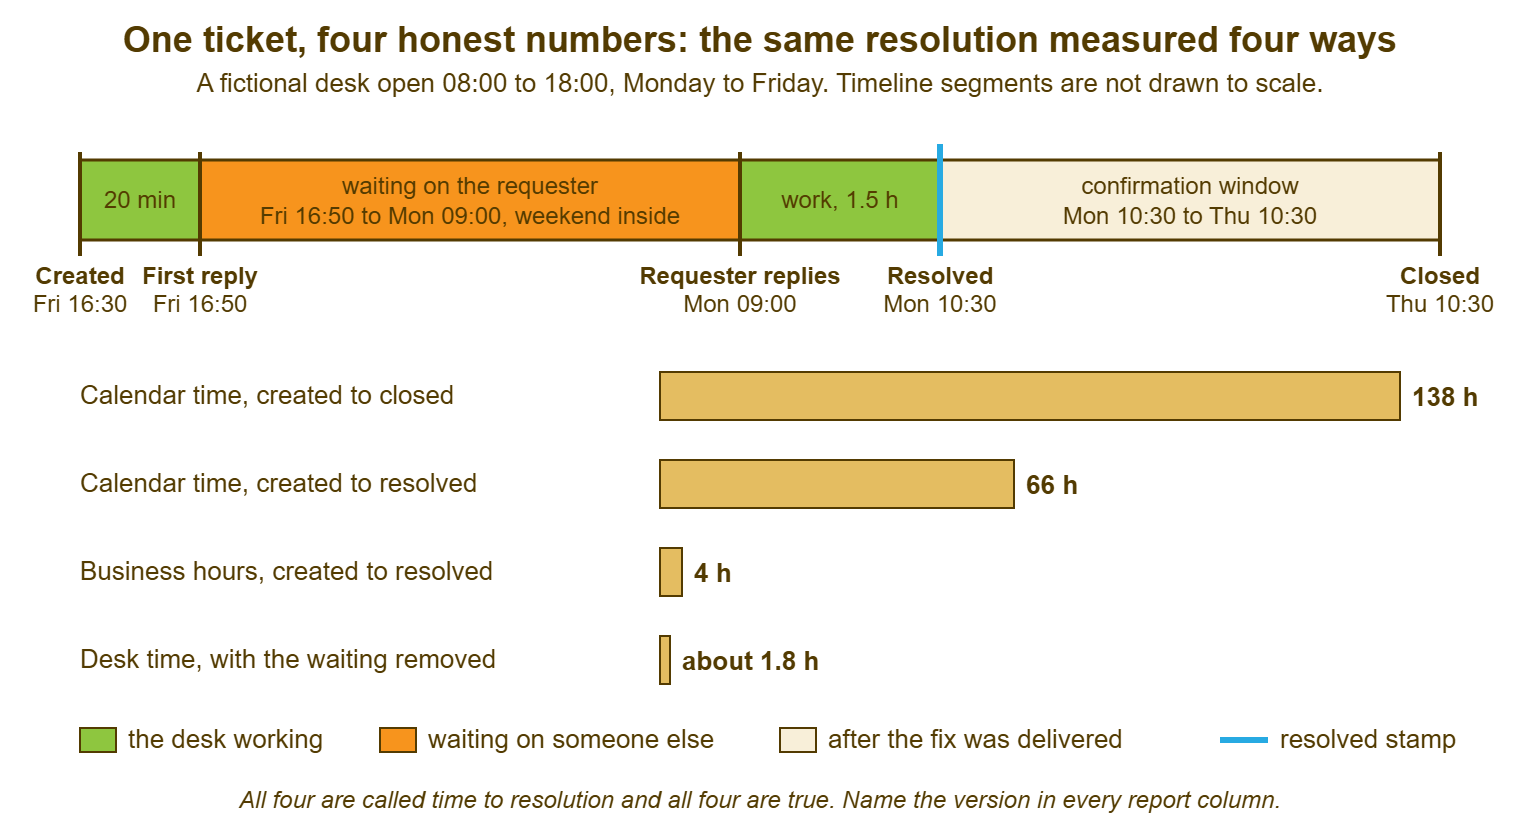
The table is the same four numbers with the question each one answers and the audience it is for. Read the right-hand column before the others. The first version answers the requester's question and belongs in the sentence you say to a director about waiting. The second answers the desk's question and belongs in the monthly review and beside the service-level target. The third answers the improvement question and belongs in the tail review and the improvement plan. The fourth answers almost nothing and is on the table because it is the one most tools report by default.
| Version | Start stamp | Stop stamp | Clock | Ticket 4471 | Use it for |
|---|---|---|---|---|---|
| Requester's view | Created | Resolved | Calendar hours, no pauses | 66 h | Talking to requesters; the honest "how long do people wait" line in the leadership report |
| Desk's view | Created | Resolved | Business hours, no pauses | 4 h | The monthly review; comparison with service-level targets; the headline median and percentile |
| Improvement view | Created | Resolved | Business hours minus time in named waiting statuses | about 1.8 h | The tail review and the improvement plan; the gap between this and the desk's view is the waiting |
| Default report, often | Created | Closed | Calendar hours, no pauses | 138 h | Nothing, once you know it includes the confirmation window; check whether this is what your tool reports |
Never mix versions inside one report, and name the version in every column header. "Median resolution time, business hours, created to resolved" is longer than "Resolution time". It is the only header that will still be understood when the person who wrote the report has moved on. The summary statistic in that header, the median rather than the average, is a decision of its own and the subject of the next article, Median and Percentiles, Not Averages. For this article it is enough to say that whichever statistic you use, it is a statistic of one of the four versions, and the report says which.
Writing the Definition Down
The definition goes on one card, agreed by the desk lead and whoever reads the report. The card is the authority when the tool and the spreadsheet disagree. The card says where the clock starts, where it stops, and which schedule it runs on. It says which waiting statuses are subtracted for the improvement view, which closing reasons are excluded, and which version is the headline. It lives in the same folder as the monthly report. And its one-line summary is printed as the footer of every chart that uses the number. A card nobody can find is a card that does not exist.
Remember: resolution time runs from the created stamp to the resolved stamp, never to closed. Report the elapsed figure as the headline, in business hours against a written schedule, and keep the waiting time as a separate number beside it. Name the version in every column header.
Re-check the card on three occasions. First, re-check it when the tool changes or is upgraded, because report definitions move between releases. Second, re-check it when the business hours change, because the configured schedule must move with them. Third, re-check it when a status is added, removed or renamed, because the list of waiting statuses on the card has just gone stale. On each occasion, take one real ticket, read its stamps, do the arithmetic by hand, and compare it with what the report says. If the two agree, the card is still true. If they do not, the report has changed its mind and did not tell you, which tools do more often than one would like.
Tell the readers of the report what changed when the definition changes. Never compare a number under the old definition with one under the new as if they were the same. A desk that moves from measuring to closed to measuring to resolved will see its number fall by the width of the confirmation window in a single month. And a director who is not warned will congratulate the desk on an improvement that did not happen, and then expect another one. Draw a line on the chart, label it "definition changed", and start the trend again from there. The first three months under a new definition are a new baseline, not a result.
A Short War Story: The Paused Clock at Tollgate Foods
At Tollgate Foods, the desk lead, Gareth, discovered that the ticketing tool's resolution report could be set to exclude time spent in the "waiting on requester" status. He switched it on because it seemed fairer to the desk. He watched the reported median fall from about fourteen business hours to about six over the following quarter. The operations manager presented that upward as the result of a new triage routine. In the same meeting, the warehouse supervisor said that her team's tickets took longer than they ever had. When Gareth pulled two hundred resolved tickets from the quarter he found that most had spent time in the waiting status. A large share of those had no question to the requester anywhere in the history. The status change clustered between a quarter to six and six in the evening. Nobody had decided to cheat; the status had simply become where tickets went at the end of the day. The quarter's reports were withdrawn. Gareth spent a week rebuilding them with elapsed time as the headline and waiting as a separate column. And the operations manager, who had put his name to the six hours, asked for the definition card in writing before he would present another number. The elapsed median had been twenty-one hours all along. A clock that can be stopped by changing a status will be stopped, and the only defence is to report the clock that cannot.
The Definition Card
The card below is the four decisions as a form, with the exclusions and the review triggers. Fill it in with the desk lead and the person who reads the report in the same room. That takes about half an hour the first time, because the discussion about waiting statuses is the whole meeting. Keep the completed card with the reports, print the one-line summary on each chart, and date every revision. Most of the blanks have a right answer for your desk that you will not know until somebody asks the question out loud.
TIME TO RESOLUTION — DEFINITION CARD, ONE PAGE
Desk: ______________________   Card version: ____   Agreed by: ______________   Date: __________

1. THE CLOCK STARTS
   [ ] at the created stamp: when the request reaches the system (mail arrival, form, chat, API)
   [ ] phone and walk-up tickets are created when the call starts, never after the fix
   [ ] a ticket logged late records its real start time, or carries a note giving it
   [ ] a merged ticket keeps the earlier created stamp; a reopened ticket keeps its original one

2. THE CLOCK STOPS
   [ ] at the resolved stamp: the reply that delivers the fix, not the closed stamp
   [ ] a reopened ticket stops at its final resolved stamp
   [ ] excluded, no resolution time: closed as duplicate [ ]  spam [ ]  withdrawn [ ]  other: __________

3. THE SCHEDULE
   Business hours: ____:____ to ____:____   Days: ______________   Public holidays excluded: [ ] yes [ ] no
   Sites on a different schedule: ______________________________
   Tool schedule checked against this one on: __________  by: __________

4. THE THREE VERSIONS KEPT
   A  Requester's view ..... calendar hours, created to resolved, no pauses
   B  Desk's view .......... business hours, created to resolved, no pauses   <- headline in reports
   C  Improvement view ..... business hours, created to resolved, minus time in the statuses below

5. WAITING STATUSES SUBTRACTED IN VERSION C ONLY
   Status: ______________   note saying what is awaited required: [ ] yes
   Status: ______________   note saying what is awaited required: [ ] yes
   Status: ______________   note saying what is awaited required: [ ] yes
   Versions A and B never pause. Waiting time is reported beside B as its own column.

6. THE SUMMARY STATISTIC
   Headline: median [ ]   Tail: 90th percentile [ ]   Average shown only beside the median [ ]
   Period: month [ ]  quarter [ ]   Minimum resolved tickets before any cut is read: ______

7. NOT THIS NUMBER (reported separately)
   Response time: created to first human reply        Handle time: technician minutes spent
   Age: how long a still-open ticket has been open (backlog report)

8. REVIEW THIS CARD WHEN
   [ ] the tool changes or is upgraded   [ ] business hours change   [ ] a status is added, removed or renamed
   Check method: one real ticket, stamps read by hand, compared with the report. Next check: __________

ONE-LINE FOOTER FOR EVERY CHART
   "Resolution time = created to resolved, business hours ____ to ____ ____, no pauses; median unless stated."
Priya filled in the card that Monday afternoon with the claims director, who turned out to have been asking for the requester's view all along. He wanted to know how long his handlers waited, and nobody had ever shown him that number because the report did not produce it. The next report carried both. The median in business hours was five; the median in calendar hours was nineteen. And the sentence between them, about nights and weekends, was the first thing the director had read on a desk report that he found interesting. The 4.3 days was never mentioned again, which is the most any number can hope for.
Frequently Asked Questions
Should the clock start when the e-mail arrives or when a technician first reads it?
Do we measure to resolved or to closed?
What about tickets a technician logs after fixing something on the phone?
Our tool only reports calendar time. What do we do?
If a ticket is reopened, does the clock restart?
Should we exclude time spent waiting on the requester?
From the QuerySolv team: we build self-hosted help desk software for Windows. QuerySolv runs as one Windows service on your own network. It takes requests by web form, e-mail, live chat, social messages and REST API. It is licensed once per installation rather than per agent per month. The free trial runs the full product for 30 days.