
Defining Each Metric Exactly, So Two People Get the Same Number
Tuesday, 08:50, at Bellweather Logistics. Dermot, the operations manager, has two reports on his desk about the same support desk, the same month and the same ticketing tool. Lena's says the median time to resolve a ticket was seven hours. Marcus's says it was nineteen. Dermot has called them both in and opened with "Which of you is lying?" It is a reasonable question from a man with two numbers and one desk, and the answer is neither. Lena counted business hours from the ticket being created to it being marked resolved, and stopped the clock while tickets waited on the requester. Marcus counted every hour on the calendar from created to closed, weekends included, because that is what the export gave him. Both are right. Dermot does not find this comforting.
An exact definition of a metric is a written statement of which tickets count, when the clock starts and stops, and which hours it counts. It says what pauses the clock, what is divided by what, and over what period. With that definition, two people given the same ticket list produce the same number without speaking to each other. It is the least glamorous document on the desk and the one that stops every argument of the kind Dermot is having. This article is part of our Helpdesk Metrics That Matter series. It is about writing that document for each of the six metrics the series tracks.
It covers the six parts of a definition, and the clock, with a picture of one ticket producing three different numbers. Then come which tickets count, the numerator, denominator and window for the rate metrics, and the decisions for each of the six as a table. It covers how to settle the argument when two reports disagree, and changing a definition without breaking the trend. It ends with a short war story and the metric definition sheet to copy, in that order.
The Six Parts of a Definition
Every metric definition has six parts, and a report that disagrees with another report disagrees on at least one of them. The population is which tickets are counted at all. The clock is when timing starts, when it stops and which hours count. The pauses are the states in which the clock does not run. The numerator and denominator are, for any metric expressed as a rate, what is divided by what. The window is the period the metric covers, and for metrics that look backwards, such as reopens, how far back they look. The summary is how the many values become one figure: a count, a median, a percentile, a share. Lena and Marcus disagreed on the clock and the pauses and agreed on everything else, and the gap between them was twelve hours on the median.
The definition is written down because metrics are compared across months and between people, and nothing in a person's head survives either. The lead who built the first report had the definition in mind when she built it. A year later she had refined it twice without noticing, and the year after that she had left. The new lead inherited a report, a trend line and no idea what the line measured. A definition that lives in one head is a metric with a single point of failure, and the point goes on holiday in August.
The written form is one short sheet per metric, kept where the team keeps its own documentation, with a version letter and the date it came into force. Every report that shows the metric names the sheet it was computed from. That sounds like more bureaucracy than a small desk needs, and it is about six sheets of a page each, written once, reviewed yearly. The sheet is at the end of this article. The rest of the article is the thinking that fills it in.
The Clock: Start, Stop, Hours and Pauses
The clock starts when the ticket was created, meaning the timestamp the tool wrote when the request arrived, not the moment a technician first read it. For a web form or a chat that is the instant of submission. For e-mail it is when the message arrived at the mailbox the tool reads. That can be minutes after it was sent and is the only moment the tool can see. For a phone call or a walk-up that a technician typed up afterwards, it is when the ticket was logged. The definition should say so. A desk that logs its walk-ups an hour late has a first response time that looks better than any requester experienced.
The clock stops at a named event. Of the two that matter, one is the first reply a person wrote that the requester could see, for first response. The other is the ticket being marked resolved, for time to resolution. Not closed. Closed arrives later, after the requester confirms or a confirmation window runs out. The width of that window is a workflow setting, not a measure of anything the technician did. A desk that times to closed is measuring its own confirmation period, and the distinction is drawn out in resolved versus closed. Automatic acknowledgements never stop the first-response clock, and neither do internal notes, because the requester saw neither.
The hours are either every hour on the calendar, called wall clock, or only the hours the desk has said it works, called business hours. The choice changes every time-based number on the desk by a large amount. A ticket raised at five on Friday and resolved at ten on Monday took sixty-five wall-clock hours and one business hour. Business hours need a schedule: the days, the opening and closing times, and the holidays. Write it on the sheet and keep it in step with whatever schedule the tool uses for its own deadlines. If your tool holds a business-hours schedule for its service-level targets, as QuerySolv does, use the same schedule for the metric. That way the two never disagree about what a day is. Where a desk serves a warehouse that runs nights, the schedule is the desk's promise, not the requester's shift, and the sheet says which.
The pauses are the statuses in which the clock does not run, and this is where Lena and Marcus parted. A ticket waiting on the requester for a reply, or on a supplier for a part, is in a waiting status. Some desks stop the resolution clock while it sits there, on the grounds that the desk could do nothing. Others let it run, on the grounds that the requester was waiting regardless of whose turn it was. Both are defensible positions and the sheet picks one. Note that this is a decision about the metric, not about the tool. Some tools pause their own deadline clock on hold and many do not. The metric can exclude waiting time or include it either way, as long as the ticket's history records when it entered and left each status. If you run QuerySolv, every status change sits in the ticket's event history. Either definition can then be computed after the fact from the same tickets. In any tool, check that the history records the entry and exit of each waiting status before you promise anyone a hold-excluded figure.
The picture below is one ticket from Bellweather's month, the one Lena and Marcus eventually sat down with. It is drawn on a timeline from Thursday afternoon to Tuesday afternoon with the desk's business hours shaded and the time on hold marked. It was created on Thursday at half past four, replied to on Friday morning, and put on hold on Friday afternoon when the technician asked the requester a question. It was taken off hold when the requester answered on Monday morning, and resolved on Monday afternoon. It was closed on Tuesday when the confirmation window ran out. Under Marcus's definition it took about a hundred and eighteen hours. Under business hours to resolved it took thirteen and a half. With the time on hold excluded, nine and a half. The same ticket, from the same tool, and three numbers, none of them wrong.
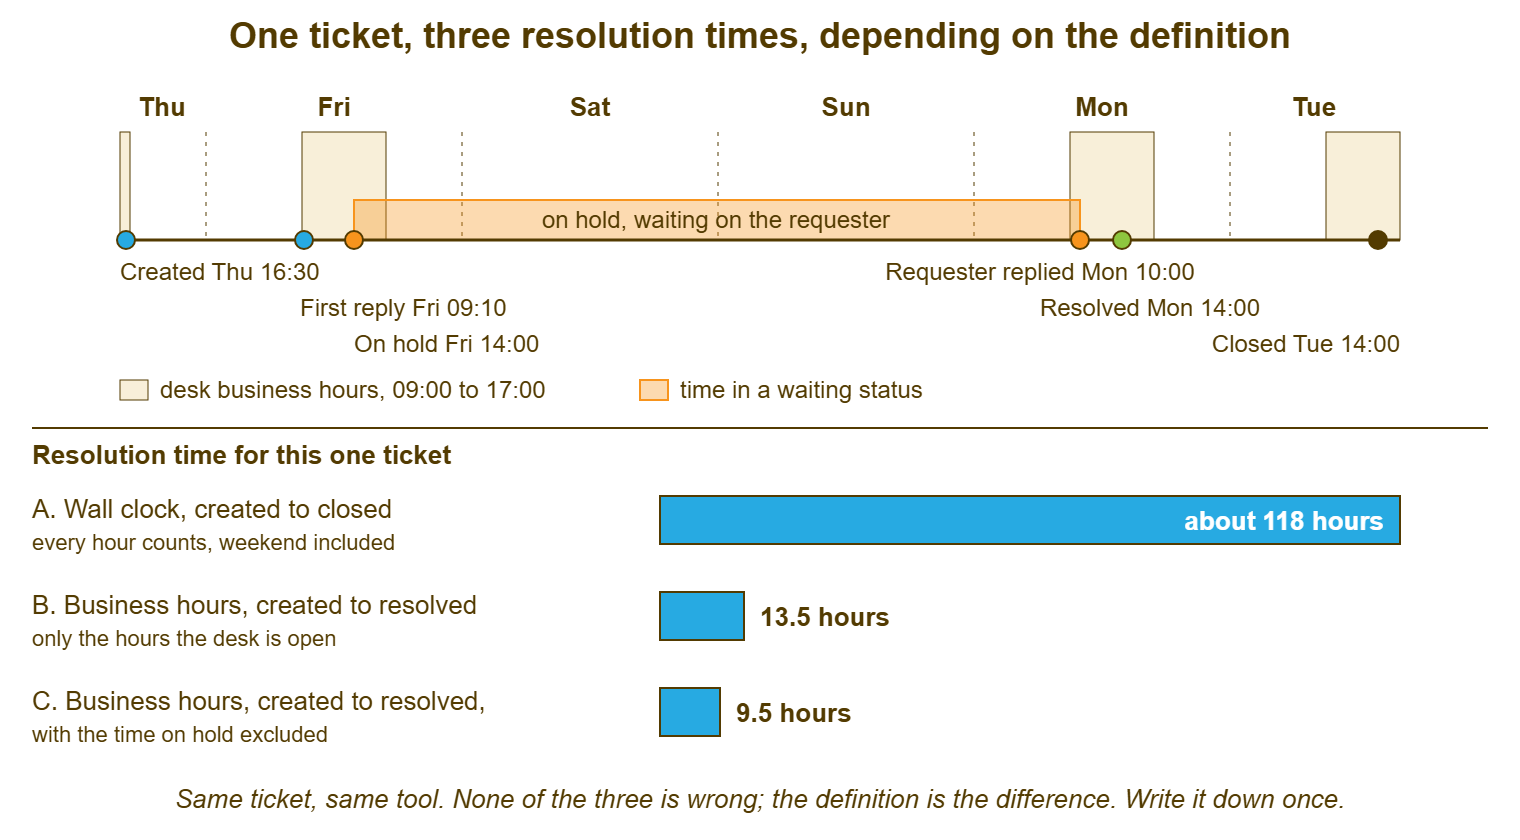
Read the picture as a list of decisions rather than as an argument for any one of them. The right answer for a desk depends on what the number is for. A desk that reports to requesters about their experience of waiting has a case for the wall clock, because the requester did wait all weekend. A desk that is measuring its own speed has a case for business hours with waiting excluded, because that is the part it controls. What no desk can defend is three technicians computing it three ways, which is what happens when the sheet does not exist.
Which Tickets Count
The population is decided before any clock. It is decided in two steps: which records in the tool are tickets at all, and which of those belong to this period. The first step removes the things that are not work. Spam and bounced mail that became tickets are removed. Duplicates that were merged count once, as the surviving ticket. Tickets split into several count as several, because each is now separate work. Test tickets from the week the new form was rolled out are removed, and so are tickets the desk raised for itself as reminders, unless the sheet says otherwise. Tickets the requester cancelled before anyone touched them are the awkward case. They belong in volume, because they arrived, and not in resolution time, because nothing was resolved. Bellweather's export showed 340 records for the month. After spam, merges and tests, the population was 303, and the first report to say 340 was the first report to be argued with.
The second step is period membership, and there are three populations for any month, not one. The tickets created in the month are volume in. The tickets resolved in the month are volume out. They are also the population for resolution time. That means resolution time is computed on the tickets that got finished and says nothing about the ones that did not. That is a real bias: a desk with a growing pile of old open tickets can show a lovely median resolution time. The slow tickets have not been resolved yet and so are not in the population. The cure is not a different clock. It is to report the backlog by age beside the resolution time, every month, so that the tickets the median cannot see are counted somewhere. The third population, tickets open at the end of the month, is the backlog. It is a snapshot taken at the same time on the same day each period, with every status that means the desk still owes somebody something.
Status names are the trap inside the population. One tool's "Resolved" is another's "Completed" and a third's "Fixed, awaiting confirmation". A desk that renamed a status two years ago may have a report that still counts the old name. The sheet maps each status the tool has to one of a few meanings, new, active, waiting on someone, resolved, closed. The metric is defined against the meanings. The design of a status set that makes this easy is in statuses that mean something. The full counting rules for volume, including channels and the count that changes when the definition changes, are in counting tickets properly. This article borrows them and does not repeat them.
Numerator, Denominator and Window for the Rates
The reopen rate has a numerator, a denominator and a window, and each has a decision in it. The denominator is tickets resolved in the month. The numerator is the tickets among them that were reopened within the window, say fourteen days of being resolved. Here, reopened means the status went from resolved back to open because the requester replied that it was not fixed or a technician found that it was not. A technician reopening a ticket to correct a note is not a reopen; the sheet says so. A ticket reopened twice counts once. The window produces an honest awkwardness: a ticket resolved on the last day of the month can still be reopened two weeks into the next. So the month's reopen rate is provisional until the window has run out on every ticket in it. Report it a month in arrears, or mark it provisional, and never quietly do one in one month and the other in the next. The full counting method is in measuring reopens honestly.
Satisfaction has two rates, not one, and they have different denominators. The score is good ratings divided by ratings received. The response rate is ratings received divided by rating requests sent. A desk that divides good ratings by requests sent gets a tiny number and a fright. A desk that reports the score without the response rate gets a large number and no idea how many people it speaks for. The sheet defines which points on whatever scale the desk uses count as good, once, and never changes it mid-year. Where a requester rated the same ticket twice, the last rating counts. Where a rating arrived with no comment, it is a rating. Where a comment arrived with no rating, it is a comment, and goes to the person who reads comments. Nothing in this paragraph depends on any tool's scale or on how it asks; those vary, and the definition is written around whatever yours does.
First response has a population problem of its own. Tickets that have not yet been replied to have no first response time. Leaving them out of the median makes the median look better the more of them there are, which is exactly backwards. The sheet calls for the median and 90th percentile over tickets replied to in the period. The count of tickets created in the period and still unreplied is shown beside them. Backlog bands have a quiet decision too, which is where age is measured from. From creation is the only sensible answer, and the sheet says it, because a desk once measured age from "last update". Under that definition, a technician who adds a note to a ticket every Friday can keep a ticket young forever.
The Decisions for Each of the Six
The table collects the decisions for the six metrics in the handful worth tracking. The choice Bellweather made is in the right-hand column as a worked example rather than a recommendation. A desk may choose differently on any row and be right; what it may not do is leave a row blank. Each row is a line on a definition sheet, and the sheet is what two people pull the number from.
| Metric | Population | Clock start and stop | Excluded or paused | Summary | Bellweather's choice |
|---|---|---|---|---|---|
| Volume | Created in period; resolved in period | None | Spam, merged duplicates, tests | Two counts | By week and by month, every channel including logged walk-ups |
| First response | Tickets replied to in period, plus a count of those not yet replied to | Created to first reply by a person | Automatic acknowledgements; internal notes | Median and 90th percentile, business hours | Business hours 08:00 to 18:00 weekdays; holidays excluded |
| Time to resolution | Tickets resolved in period | Created to marked resolved | Time in waiting statuses | Median and 90th percentile, business hours | Waiting time excluded; the slowest ten listed by number |
| Backlog by age | Open at period end, all statuses owing the requester something | Age from creation to the snapshot | Nothing | Count per band; oldest ticket | Snapshot last working day at 17:00; bands under 7, 7 to 30, over 30 days |
| Reopen rate | Resolved in period | Resolved to reopened, within the window | Technician note corrections; second reopens of the same ticket | Count and share in 100 | Fourteen-day window; reported one month in arrears |
| Satisfaction | Ratings received on tickets resolved in period | None | Comments without a rating | Good ratings over ratings; ratings over requests sent | Top two points of the scale count as good; last rating per ticket |
Remember: a metric is defined when two people with the same ticket list get the same number without talking. Write the population, the clock, the pauses, the numerator, the denominator, the window and the summary on one sheet per metric. Version it, and compute nothing that does not name its sheet.
When Two Reports Disagree
Two reports that disagree are not a crisis and nobody is lying. A definition that was never written is finally being written, in a meeting room, with a manager watching. Do not argue about the numbers. Compare the definitions, in the six parts, and the disagreement will fall out of one of them within ten minutes. Lena and Marcus found theirs in the time it took to say "did you use business hours?" The fastest route when the definitions are not written is to work backwards from the ticket lists. Get each person's list of tickets that went into the figure, and find the tickets in one list and not the other. The population difference is explained. Then take one ticket that both lists include and compute its time by hand both ways. The clock difference is explained.
The hand check is the most useful habit in this article and it takes ten minutes a month. Pick five tickets from the period at random, open each one's history, and compute the metric by hand with the sheet in front of you. Work through it: created at this time, first reply at this time, on hold from here to here, resolved at this time, so many business hours. Then compare with what the report says for those five. If they agree, the report is using your definition. If they do not, the report is using a definition you did not know about, which it will do with total confidence for as long as nobody checks. I once found a report that had been counting a Saturday as a working day for a year, because the schedule had been copied from a desk that worked Saturdays. The medians had all been slightly wrong in the same direction, which is the kind of wrong that nobody notices.
Tool-generated reports have definitions too, and they are usually in the help text rather than on the screen. Read it, and then test it rather than trusting it. Create a ticket at five to five on a Friday and resolve it at five past nine on Monday. See whether the report says ten minutes or sixty-four hours. Put one on hold over a weekend and see whether the resolution time moved. Reply to a resolved ticket from a personal address and see whether it reopened, and whether the reopen report noticed. Three test tickets will tell you more about the tool's definitions than an afternoon with its documentation, and they will tell you the truth.
Changing a Definition Without Breaking the Trend
Definitions change, and the trick is to change them without destroying the comparison with last year. The usual reasons are good ones. The hand check found that the report excluded a status it should have included. The desk changed its hours. A new department came onto the tool with different waiting statuses. Change at a quarter boundary where you can, never in the middle of a month, and never because this month's number looks bad under the current definition. A definition that changes whenever the number disappoints is not a definition. It is a mood with a version letter.
When a definition changes, recompute the previous three months under the new one, so that the trend line continues without a step that means nothing. Mark that change on the chart with a vertical line and the version letter. Keep the old figures in a column beside the new ones for a quarter, so anyone comparing with an old report can see both. Write the change in the sheet's log with the date, what changed, and why, in one line. A chart with a definition change and no mark on it has a lie in the middle. The person who finds it will not assume it was innocent.
Keep the sheet as the single source. Reports name the sheet and the version. The dashboard names the sheet. The slide for the quarterly review names the sheet in a footnote nobody reads until they need it. When a new lead inherits the desk, the six sheets are the part of the handover that explains every number on every report. That part takes an hour to read. The sheets are also what makes it possible to answer when a director asks how the desk compares with another organisation's figures. You can say that the comparison means nothing unless their sheets match yours, which they will not. The trend against yourself is the only comparison the definition supports, and that is enough.
A Short War Story: The Two Medians at Ashgrove Housing
At Ashgrove Housing, the desk lead, Owen, reported a median resolution time of six business hours to the board. In the same month an external review of the housing management system, commissioned for other reasons, quoted the same desk's median resolution time as two and a half days. The board spent most of two meetings on the discrepancy, and a director used the word "integrity". Owen spent about forty hours over the following month assembling ticket lists, recomputing by hand and writing a paper. The paper explained that the review had timed every ticket on the wall clock from creation to closure. It also explained that the desk's workflow closed tickets automatically five working days after resolution. Both figures had been correct. The board's eventual conclusion, after a consultant had been paid for a fortnight to say so, was that the desk should write down how it measured things. Owen wrote six definition sheets in an afternoon, put the version letter on every report, and sent the review's authors a copy. Two numbers that disagree cost a week of a lead's time and a consultant's fortnight. The sheet that prevents them costs an afternoon, and it is always cheaper to spend it first.
The Metric Definition Sheet
The sheet below is filled in once per metric, six times for the six in this series, and kept with the team's own documentation. Sections one to five are the definition and are the parts two people need to agree on. Section six is the monthly hand check, which is what keeps the report honest after the sheet is written. Section seven is the change log, which is what keeps the trend honest after the sheet changes. The boxes with alternatives are decisions, and every one of them is ticked; a blank box is the argument waiting to happen.
METRIC DEFINITION SHEET — ONE PER METRIC
Metric: ______________________   Version: ___   In force from: ________
Owner: ______________   Report that uses it: ______________________

1. THE QUESTION IT ANSWERS
   ____________________________________________________________

2. POPULATION (which tickets count)
   Tickets in scope:  [ ] created in period  [ ] resolved in period  [ ] open at period end
   Departments or queues: ______________________
   Excluded:  [ ] spam and bounces   [ ] merged duplicates (survivor counts once)
              [ ] test tickets       [ ] cancelled by requester before first touch
              [ ] internal tasks     [ ] other: ______________________
   Status map:  new = ________  active = ________  waiting = ________
                resolved = ________  closed = ________

3. CLOCK (time-based metrics only)
   Starts at:  [ ] ticket created   [ ] other: ______________
   Stops at:   [ ] first reply by a person   [ ] marked resolved   [ ] closed
   Hours:      [ ] business hours ____:____ to ____:____ on ______________
               [ ] wall clock
   Holidays excluded:  [ ] yes  [ ] no     Schedule kept in: ______________
   Pauses:     [ ] none   [ ] time in these statuses excluded: ______________

4. NUMERATOR, DENOMINATOR AND WINDOW (rates only)
   Numerator:   ______________________________________________
   Denominator: ______________________________________________
   Window: ____ days after ______________    Provisional until: ______________
   The same ticket counted more than once:  [ ] never   [ ] when: ______________

5. SUMMARY REPORTED
   [ ] count   [ ] median   [ ] 90th percentile   [ ] share in 100
   [ ] age bands: under ____ / ____ to ____ / over ____ days, plus the oldest
   Always shown beside: ______________________ (partner metric; sample size)
   Per-technician cut:  [ ] never   [ ] lead only, above ____ tickets, for coaching

6. MONTHLY HAND CHECK
   Five tickets recomputed by hand: ______  ______  ______  ______  ______
   Report and hand agree:  [ ] yes   [ ] no, because: ______________________

7. CHANGE LOG
   Version ___   date ________   changed: ______________________
   Recomputed back to: ________   Marked on the chart:  [ ]
Lena and Marcus filled in the time-to-resolution sheet together on the Tuesday afternoon and chose business hours with waiting time excluded. They recomputed the previous three months both ways so that Dermot could see the two lines side by side with the gap between them explained. The median under the agreed definition was seven hours, as Lena had said. The report now says so in a footnote that names the sheet. Dermot has not asked who is lying since. He has asked, twice, what the version letter means, which Lena considers progress.
Frequently Asked Questions
Should resolution time include the time a ticket spent waiting on the requester?
Our tool's report and my spreadsheet give different medians. Which do I trust?
Do cancelled or withdrawn tickets count?
How do I handle tickets that span two months?
How often should the definitions be reviewed?
Can we use a different business-hours schedule for different departments?
From the QuerySolv team: we build self-hosted help desk software for Windows. QuerySolv runs as one Windows service on your own network. It takes requests by web form, e-mail, live chat, social messages and REST API. It is licensed once per installation rather than per agent per month. The free trial runs the full product for 30 days.