
Charts That Help and Charts That Hide the Answer
Wednesday, 16:50, at Meridian Parts. Theo, who runs the desk, has sent the monthly report with three pictures in it. The previous month's report had no pictures and the managing director had said it looked "a bit thin". The first is a pie chart of tickets by category, fourteen slices, three of them too narrow to label. The second is a screenshot of the team's dashboard, taken that morning. The third is a bar chart titled "SLA Attainment", with months along the bottom and no indication of which months. At 16:50 the managing director, Gordon, forwards the report to the operations manager with one line: "Can one of you tell me whether the big orange slice is good or bad?" The big orange slice is labelled "Other". It is the largest slice on the chart, and nobody on the desk can say what is in it either.
A chart in a report to leadership is a picture that answers one question faster than the number alone would. That is the whole test, and most charts in most reports fail it. They answer no question, or several at once, or a question nobody asked. Or they take longer to decode than the sentence they replaced. Three charts pass the test for a help desk: created against closed, the backlog by age, and a single trend line. Each answers one of the three questions leadership actually has. A longer list of charts hide the answer, and the pie, the dashboard screenshot and the chart with no date lead it. This article is part of our Reporting to Leadership series, and it is about choosing the three and refusing the rest.
It covers what a chart is for. Next come the three that help, one at a time, then the pie chart and the dashboard screenshot. The article covers the chart with no date and its cousins, then making any chart honest. It finishes with a short war story and the chart choice table to copy, in that order.
What a Chart Is For
A chart earns its place on the page by answering a question faster than the number does. The test for that is whether the question can be written as the chart's title. "Are we keeping up?" is a title. "Tickets" is a noun, and a chart with a noun for a title is a chart that was made because the tool offered it. Write the question first, then ask whether a number alone answers it. "138 open, up from 110" answers "how big is the backlog?" in six words. A bar chart of the same two numbers takes longer to read and says less. Draw a chart only when the answer is a shape rather than a figure. That is when the question is about direction, comparison across months, or the parts of a whole that are growing.
One chart answers one question, and the reader's eye should be able to find the answer in the time it takes to read the title. Consider two questions on one chart: created and closed and the backlog and the median all on a single picture with two axes. That is a chart that answers nothing because the eye does not know where to land. If the page has two questions that need shapes, it has two small charts, and the second one costs a sentence of space elsewhere. The monthly page in The Monthly Report They Will Actually Read carries five numbers and three sentences and usually no chart at all, because most months the numbers answer the questions. The charts belong to the quarterly review, where the question is about direction and a shape is the honest answer.
Every chart has a sentence underneath it saying what it shows, and the sentence is the thing the reader will remember. "Created and closed have tracked together for five months; the gap in June was the planning system outage." The chart is the evidence for the sentence; the sentence is the report. A chart with no sentence is a puzzle set for a reader with two minutes. And a reader with two minutes does not do puzzles. They forward it to someone else with a question about the orange slice.
Chart One: Created Against Closed
The first chart that helps is a pair of bars for each month, tickets created beside tickets closed, over six to twelve months. And it answers "are we keeping up?" When the two bars match, the desk is clearing what arrives. When created runs above closed for three months, the backlog is growing and the chart shows it before the backlog number has become alarming. When closed runs above created, the desk is digging out. The shape of the pair across months is the answer. And the reader sees it before reading a single figure, which is exactly what a chart is for. The data comes from the volume report, which counts tickets created in the month and tickets closed in the month as two different things. The difference between those two counts and the count of tickets open is the subject of Counting Tickets Properly. The chart depends on getting it right.
Draw it with the bars starting at zero, the same scale every month, and the month names along the bottom. Keep the two colours the same from one report to the next so that the reader learns them once. Six months is the shortest run that shows a shape. Twelve is better once the desk has them, because the same month last year is the most useful comparison the desk will ever have. Do not add a third bar for backlog. The backlog is the running total of the gaps. And it belongs on the second chart, where its age can be shown. On this one it is a tall bar that flattens the two that matter.
What this chart cannot say matters as much. It shows that the desk closed 405 tickets and says nothing about how old the open ones are or whether the people who raised them were helped. A desk can keep created and closed matched for a year while thirty tickets rot in a corner, and the chart will look fine throughout. That is why it is read beside the second chart and never alone.
Chart Two: Backlog by Age
The second chart is the open backlog on the first working day of each month, drawn as one bar per month split into age bands. And it answers "is anything rotting?" Three bands are enough. Tickets under a week old are a queue. Tickets between a week and a month old are work in progress. Tickets over thirty days are the band the reader should look at and the only one that should be red. The chart's height is the backlog, which the first chart already implied. The chart's point is the red band, and whether it is growing. A backlog of 160 with twelve old tickets is a busy desk. A backlog of 112 with thirty-one old tickets is a desk with a problem, and only this chart shows the difference.
Take the snapshot on the same day each month, from the backlog-by-age report, and say so under the chart. A backlog measured on the first of one month and the fifteenth of the next is two different things drawn as one. How to read the bands, and what the tickets in the red band usually turn out to be, is the subject of Reading an Aging Report. The chart is the aging report with its months laid side by side. If you run QuerySolv, the backlog-by-age report and the volume report give the two columns these first two charts need. In any tool, the chart must be drawn from a report you can run again next month the same way. Otherwise, the months will not be comparable and the shape will be a fiction.
The red band is the chart's whole argument and the sentence under it says what the red is. "Thirty-one tickets over thirty days, twenty-eight of them waiting on the housing supplier" is the sentence; the chart shows that the thirty-one is new this quarter and the sentence says why. Without the sentence, a reader sees red and assumes the desk is slow, which is the wrong conclusion and the natural one. (Red is the colour of a reader's attention. Spend it on the band that deserves it and nowhere else on the page.)
Chart Three: The Trend Line
The third chart is one metric drawn as one line over twelve months with the months on the axis. And it answers "which way is it going?" The metric is usually the median time to resolve. It is the number most likely to drift slowly in a direction nobody notices month to month. The median is used rather than the average because one ticket that waited forty days moves an average line and the reader's eye with it. The reason is worked through in Median and Percentiles, Not Averages. Twelve points is the minimum for a trend. Six points is a shape that could be weather. Three points is two lines joined together, and a report that calls that a trend will be remembered for it.
A dashed trend line through the points is allowed, once, and only if the sentence underneath says what it is: "the dashed line is the overall direction over the year". The axis starts at zero. A line that drops from 8.1 hours to 6.4 looks like a cliff on an axis that starts at six. It looks like the gentle improvement it was on one that starts at nothing. The dates are on the axis, every one of them or every other one, and the chart's subtitle says which twelve months. A trend line with no dates is a shape with no meaning, and that is the next section. The picture below shows all three charts for Meridian's fictional desk, each with its question as its title, its dates on the axis, and its one-line note.
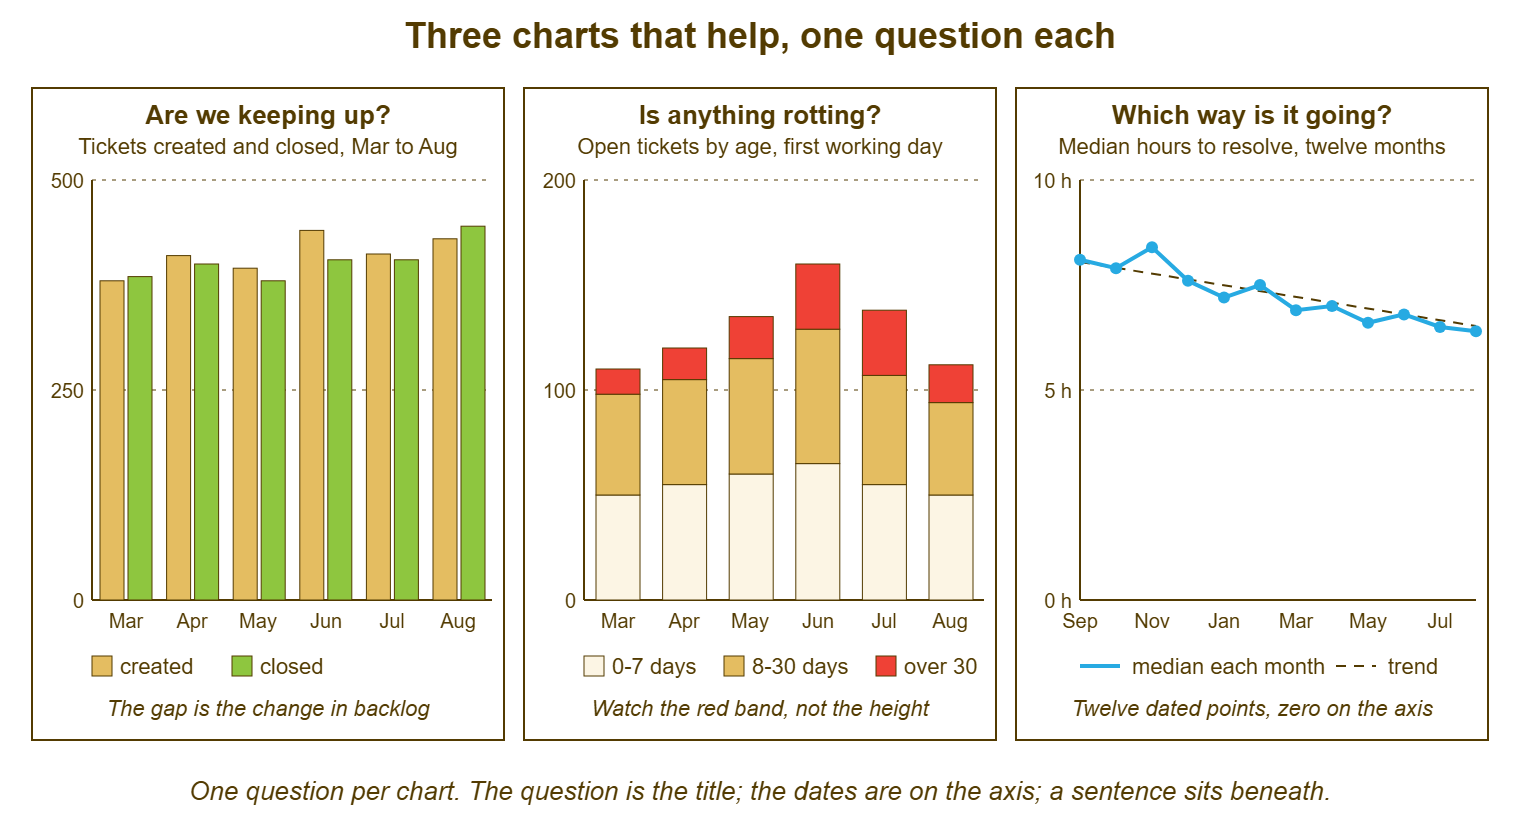
Read the three together and the month tells its story without a word. Created ran ahead of closed in June, and the red band jumped the same month. And the median kept falling anyway because the old tickets were waiting on a supplier rather than on the desk. That is three questions answered in one glance, and the sentences under the charts confirm what the glance suggested. It is also the most charts a quarterly page should carry. If a fourth question needs a shape, one of these three gives way for a quarter, and the trade is said out loud.
The Pie Chart
The pie chart hides because people cannot compare angles, and a pie is nothing but angles. Two slices that differ by a tenth look the same. A slice at the top looks larger than the same slice at the side. A chart of fourteen categories has eleven slices too thin to label. That is how "Other" became the largest category at Meridian without anyone deciding it should be. A pie of tickets by category answers the question "what were the tickets about?", which is a desk question rather than a leadership one. It answers it worse than a sorted list of five categories with a count beside each. A pie chart is a way of making fourteen numbers unreadable at once.
The pie also hides time, which is the dimension leadership most needs. A pie is a single month with no before and no after. The reader cannot see that the printer slice was half the size last quarter. They cannot see that the expenses-system slice did not exist until the new system arrived. The category question, when it belongs on a leadership page at all, belongs as a sentence: "a third of this quarter's tickets were about the new expenses system, up from almost none before it was introduced". The sentence has a number, a comparison and a cause. The pie has an orange slice.
If a picture of the categories is wanted, draw a horizontal bar chart of the top five, sorted largest first. Write the count on each bar. Add a sixth bar for everything else, labelled with what the everything-else mostly is. The eye compares lengths well and angles badly, and the sorted order does the reader's work for them. Even then, ask whether the page needs it. The leadership question is almost never "what were the tickets about?" and almost always "is there something I should decide about?" A category chart answers the second only when one category is the month's story, which is a sentence.
The Dashboard Screenshot
The dashboard screenshot hides because a dashboard shows now and a report shows a month. A picture of Wednesday morning pasted into a page about April is a different document pretending to be evidence. The tiles on a dashboard are counts at an instant: unassigned, overdue, waiting. They were built so that the team can decide what to do next, not so that a reader can judge a month. A reader who sees "Overdue: 47" in red has no way of knowing whether that is a bad morning or a normal one. Or it might be the morning after a holiday when nobody worked. The dashboard's purpose, and why it is a tool rather than a report, is the subject of the Team Dashboards series. The article Keeping Dashboards Honest covers the stale tile and the number nobody questions.
The screenshot also carries everything the dashboard carries, including the things that were never meant to leave the desk. A wall screen with a per-technician column on it, screenshotted into a leadership report, has just put a ranking in front of a director. The audience rules in The Numbers to Show and the Numbers to Keep have been broken by a paste. Colours on a dashboard mean something to the team and nothing to the reader. A red tile is an alarm to the desk and an accusation to everyone else. The dashboard is a good tool. A photograph of a tool is not a report on the work done with it.
When a reader asks for "a screenshot of the dashboard so I can see what you see", what they want is reassurance that the desk is watching. The answer is a sentence: "we review the queue together every morning, and the overdue count at that review has been under ten on all but three days this month". That is a fact about a month, from a dashboard, in a form a reader can use. The screenshot would have told them about one morning, and probably the wrong one.
The Chart With No Date, and Its Cousins
The chart with no date hides because a shape with no time on it is a shape about nothing. Theo's "SLA Attainment" chart had months along the bottom and no indication of which months or which year. A reader cannot tell whether the dip in the fourth bar was last spring or three years ago. They cannot tell whether the chart has been pasted unchanged into every report since it was first drawn. Every chart carries its date range in the subtitle and the month names on the axis. And the subtitle says what day the snapshot was taken where it matters. A chart that could be from any period is from no period, and a reader who notices that once will check every chart afterwards.
The cousins are the small dishonesties that a charting tool makes easy. The bar chart whose axis starts at something other than zero, so that a change of a tenth looks like a collapse. The chart with two vertical axes, one for tickets and one for hours, which lets any two lines be made to cross wherever the author likes. The average line drawn across a month of medians. The chart with a target line on it that was not an agreed target but a number the author thought looked about right. The three-dimensional bar chart, which makes the front bars look larger than the back ones. The cumulative chart, which only ever goes up and therefore always looks like growth. None of these is lying, exactly. Each is a chart that has been asked an easy question and dressed for the occasion.
The table below is the short list of the charts that hide, what each one hides, and what to show instead. Most reports have at least one of these in them, and most authors did not put it there to deceive. They put it there because the tool had a button, the page looked thin, and a picture is a picture. The fix is the same for all of them: ask what question the picture answers and whether a sentence would answer it better.
| Chart that hides | What it hides | Show instead |
|---|---|---|
| Pie chart of tickets by category | Comparison between slices; everything in "Other"; any change over time | A sentence about the one category that is the story, or a sorted bar of the top five with counts |
| Dashboard screenshot | That it is one instant, not a month; the team's internal numbers; what the colours mean | A sentence about the month's queue, from the morning reviews |
| Chart with no date range | Which months it covers; whether it has been updated | The same chart with the range in the subtitle and months on the axis |
| Bar chart not starting at zero | The true size of the change | The same chart from zero, even if the bars look boring |
| Two vertical axes | Which line is which; the relationship between them, which the author chose | Two small charts, one question each |
| Average line across the months | The outliers that dragged it, and the median most people experienced | The median line, with the 90th percentile as a sentence if the tail matters |
| Target line nobody agreed | That the target was invented for the chart | The agreed service-level target, or no line at all |
| Cumulative total | Whether the rate is rising or falling; it always climbs | Per-month counts as bars |
| Three-dimensional or decorated chart | The values, behind the perspective and the shading | The flat version |
| Chart with per-technician names | Nothing, which is the problem; it shows a ranking | A team total and a sentence from the lead |
Remember: one chart answers one question. The question is the title, and the date range is in the subtitle. The axis starts at zero, and the scale is the same every month. And a sentence beneath the chart says what it shows. If a number answers the question, there is no chart.
Making the Chart Honest
The checklist below is applied to every chart before it leaves the desk, and it takes a minute. It exists because most dishonest charts were drawn by honest people in a hurry with a tool that defaulted to something pretty. A minute of checking catches nearly all of them. The last item is the one most often skipped and the one that matters most. A chart is evidence for a sentence. If the sentence cannot be written, the chart is not saying anything and comes off the page.
- The title is the question the chart answers, written as a question.
- The subtitle gives the date range and, for a snapshot, the day it was taken.
- The axis is labelled with its units and starts at zero for bars.
- The scale is the same as last month's version of the same chart.
- The months are named along the bottom, in order, with none missing.
- Colours carry one meaning each, the same meaning as in every other chart on the page, with a legend if there are more than two.
- No technician's name appears anywhere on the chart.
- The data comes from a saved report that can be run again the same way next month, and the sources line says which.
- One sentence beneath the chart says what it shows and why, and the sentence would be true without the chart.
Draw charts with the plainest tool available and the fewest options switched on. The spreadsheet's default bar chart, with the colours set to the desk's two or three standard ones, is better than anything a dedicated charting feature will produce on its own. That is because the defaults are dull and dull is honest. A chart should look the same every month, so that the reader looks at the data and not at the chart.
Keep the data behind every chart in the same spreadsheet, one tab per chart, one row per month, appended each month and never overwritten. In a year the spreadsheet is the quarterly review's raw material. In two years it is the only trustworthy history of the desk the organisation has. The tool's reports show today's definitions applied to old tickets, and the spreadsheet shows what was reported at the time. Theo's three charts, redrawn this way, took him an hour the first month and ten minutes thereafter. That is less time than the pie chart's fourteen categories took to colour.
A Short War Story: The Screenshot at Pennant Schools Trust
Pennant Schools Trust ran the IT for seven schools from one desk. A lead called Ruth put a screenshot of the desk's dashboard at the top of the termly report. The trust's finance director had asked to "see what the team sees". The screenshot was taken at nine on the first morning after a half-term break. It showed "Overdue: 47" in a red tile above everything else. The finance director took the report to the trust board as evidence that the desk was not coping. The board minuted "concerns about IT responsiveness". And a planned second technician post, which Ruth had spent a term building the case for, was put on hold pending review. Ruth spent most of the following week producing the month's actual figures. They showed the forty-seven had been cleared by the Wednesday. They showed that the term's median time to resolve was the best the desk had recorded. They showed that the red tile had been showing the week nobody worked. The board unfroze the post two meetings later, and the minute stayed in the record. The finance director, who had acted in good faith on a picture, asked thereafter for charts with dates on them. A screenshot is one moment pretending to be a term, and it will choose the wrong moment.
The Chart Choice Table
The table below is the template. It lists the questions a leadership reader asks of a help desk, the chart that answers each, the data it is drawn from, and the period it covers. There is a column for the sentence that goes beneath it and a column for what never goes on it. Most rows say "no chart", and that is the point of the table; the three that help are the three that say yes. Copy it and keep it beside the quarterly page. When a reader asks for a chart that is not in the table, find the question they are asking and look up what answers it. The worked-example sentences are from the fictional desks in this article.
| The question | Chart | Data and period | The sentence beneath it | Never |
|---|---|---|---|---|
| Are we keeping up? | Paired bars, created and closed, per month | Volume report; six to twelve months | "Created and closed have tracked together for five months; the gap in June was the planning system outage." | A third bar for backlog; a non-zero axis |
| Is anything rotting? | Stacked bars of open tickets in three age bands, per month | Backlog-by-age report on the first working day; six to twelve months | "Thirty-one tickets over thirty days, twenty-eight of them waiting on the housing supplier." | More than three bands; red for anything but the oldest band |
| Which way is it going? | One line, one metric, twelve months, dates on the axis | Monthly median time to resolve, or whichever metric is the quarter's story | "The median has fallen from about eight hours to about six and a half over the year." | An average; fewer than six points; two axes |
| How did this month compare? | No chart | This month and last month, side by side on the page | "Backlog 138, up from 110." | A two-bar chart of two numbers |
| What were the tickets about? | Usually no chart; a sorted horizontal bar of the top five if the shape matters | Tickets by category, this quarter against last | "A third of the quarter's tickets were about the new expenses system." | A pie; more than six bars; "Other" as the largest |
| Which department raises the most? | No chart on a leadership page | Department slice, in the department head's own conversation | "The expenses system generates most of finance's requests." | A comparison between departments |
| How are the technicians doing? | No chart, ever | Per-person figures stay with the lead, above a minimum sample | "Everyone is within the normal spread for their mix of work." | Any name beside any number |
| What happened on the bad day? | No chart | The incident ticket | "About 140 people could not reach the shared drive for three hours on Tuesday morning; it is fixed." | A dashboard screenshot |
| Did the change work? | Paired bars, before and after, with the change date marked | The affected ticket type, three months either side | "VPN tickets fell from about forty-six a month to about nineteen after the article was published." | Claiming the whole drop without the control check |
| Is the desk busier than a year ago? | The created-and-closed chart extended to twenty-four months, or a sentence | Volume report, same months both years | "Requests are up about a tenth on the same quarter last year, in line with headcount." | A cumulative line |
Theo's next report had no pie, no screenshot and one chart: the created-and-closed pairs for six months. It had "Are we keeping up?" as its title and a sentence underneath about June. Gordon replied asking what had happened in June, which was the question the chart had been drawn to prompt, and the answer was two lines. Nobody has asked about the orange slice since, because nobody has seen it since. It is still in the spreadsheet, labelled "Other", where it belongs.
Frequently Asked Questions
Should the monthly one-page report have any chart at all?
Our tool only produces pie charts and averages. What do I do?
How many months do I need before a trend line is honest?
Leadership likes the pie chart. Do I have to take it away?
Can I colour the whole backlog bar red when it is high?
Is a before-and-after chart for a fix honest?
From the QuerySolv team: we build self-hosted help desk software for Windows. QuerySolv runs as one Windows service on your own network. It takes requests by web form, e-mail, live chat, social messages and REST API. It is licensed once per installation rather than per agent per month. The free trial runs the full product for 30 days.