
The Monthly Report They Will Actually Read
Monday, 09:10, at Ashgrove Housing. Dana, who runs the four-person desk, sends the monthly report to Mark, the finance director she reports to. It is eleven pages. There is a chart of tickets by category, a table of tickets by category by week, and a page per technician. There is a section on the knowledge base and two paragraphs about the printer contract. It took her most of Friday afternoon. At 09:14 the reply arrives: "Thanks Dana. Is there anything in here I need to do?" Four minutes is not long enough to read eleven pages. It is, she realises, about the length of time Mark has spent on each of the nine reports she has sent him. In nine months not one of them has answered the only question he has ever asked about them.
A monthly report to leadership is one page that tells the people who fund the desk whether anything needs deciding. A handful of numbers they can check and a short account of what changed back it up. It is not a record of what the desk did; that record is the ticket system. It is not the desk's own monthly read of its numbers; that is the scorecard, and it is longer and stays inside the team. The report is the page that goes up. And its whole job is to be read to the end by someone with two minutes and a decision to make. This article is part of our Reporting to Leadership series. The series covers the monthly page, translating tickets into business language, and which numbers go up and which stay inside the team. It also covers charts that help and charts that hide, the quarterly review, and what to do when the numbers are bad.
It covers who reads the report and for how long, followed by the five numbers and the question each one answers. Then come the three sentences, the one ask, what to leave out, and the page laid out. Next it covers producing it in fifteen minutes, sending it and reading what comes back. A short war story and the one-page monthly report to copy follow, in that order.
Who Reads It, and For How Long
The reader is someone whose job is to decide things, and they read your report between two other things. On a phone, in a corridor, in the four minutes before a meeting that is not about the desk. They are not going to open an attachment, scroll a table, or compare two charts. If the page does its work in two minutes of their attention it has worked. If it needs ten, it has not, and nothing in the remaining eight minutes will be seen. Design for the two minutes you will get, not the ten you deserve.
Leadership does not want to know about the desk. That sounds harsh and is simply true. They want to know whether the organisation's people are being looked after and whether anything is going wrong that will reach them. They also want to know whether there is anything they need to do about it. Every number and sentence on the page exists to answer one of those three questions. A fact that answers none of them is interesting to the desk and invisible to the reader, however carefully it was produced.
The report has one more reader, the one most people forget. This is the person who, in a meeting you are not in, is asked "how is IT doing?" and has to answer in one sentence from memory. If your report gave them that sentence, they will say it. If it gave them eleven pages, they will say "fine, I think", and the desk's month has been summarised by a shrug. Write for the person who has to repeat you.
Eleven pages a month for nine months is about a hundred pages. Mark had read the subject lines. That is not a criticism of Mark; it is a description of what a hundred pages addressed to a finance director gets. And the fix is not a more diligent director. The fix is a page.
Five Numbers, and the Question Each Answers
Use five numbers, because five fit across the top of a page and can be scanned without being read. Five is also enough to answer the three questions above. The definitions, and the desk's own longer monthly scorecard, live in Reading Metrics Together. The five on the leadership page are a selection from that scorecard: the same metrics with the desk-only ones left behind. Each is chosen because it answers a question a leader actually asks.
The numbers below are Ashgrove Housing's for one month, a worked example from a fictional desk. And the figures are there to show the shape, not to be copied. The first is tickets in and tickets closed: 412 arrived, 405 were closed. The question it answers is "are we keeping up?" The answer is in the gap between the two, read over several months. One month of out below in is weather; three is a trend. The second is the open backlog and how many of those tickets are older than thirty days: 138 open, 31 over thirty days. The question is "is anything rotting?" The thirty-day count is the one to watch. A backlog of recent tickets is a queue and a backlog of old ones is a problem. How to read the age bands properly is in Reading an Aging Report.
The third is the median time to resolve, in business hours: 6.5 hours at Ashgrove that month. The question is "how long do people wait?" Use the median, the middle ticket when they are lined up by time, rather than the average. One ticket that waited forty days on a supplier moves an average by hours and the median by nothing. The fourth is satisfaction, shown as a count of good ratings over the count of replies, 56 of 61. Never show it as a score standing alone. A score of nine from nine replies and a score of nine from ninety are different facts. The fifth is the one that is not in any report: the month's biggest interruption, as people affected times hours lost. At Ashgrove it was the shared drive, down for three hours on a Tuesday morning with about 140 staff unable to reach it. The question is "what did the business lose?" This is the number leadership will repeat, because it is the only one of the five in their own units. Turning desk figures into those units is the subject of Translating Tickets Into Business Language; the report just carries the result.
| Number | Where it comes from | The question it answers | How it is written on the page |
|---|---|---|---|
| Tickets in / tickets closed | The volume report for the month | Are we keeping up? | Two counts, this month and last month beside them |
| Open backlog / older than thirty days | The backlog-by-age report on the first working day | Is anything rotting? | Two counts; the thirty-day count is the one to read |
| Median time to resolve | The resolution time report, business hours, resolved tickets only | How long do people wait? | One figure in hours or days, with last month beside it |
| Satisfaction | The survey results for the month | Did they think we helped? | Good ratings over replies, never a score alone |
| Biggest interruption | The month's worst incident ticket, worked out by hand | What did the business lose? | People affected times hours, and what it was, in six words |
Every number is shown with last month's beside it, because a number alone has no direction. "138 open" tells a reader nothing; "138 open, up from 110" tells them which way to look. A third column for the same month last year is worth adding once the report has run a year, and not before. A column of blanks is a column of questions. Keep the five the same every month. A report that changes its numbers loses its trend and, soon after, its trust, since a reader cannot tell a changed definition from a changed desk. If a number must change, say so on the page in the sources line, and show both versions for a month.
If you run QuerySolv, the first four come out of the standard reports on volume, backlog by age, resolution times and satisfaction. In that case, you write the fifth yourself from the month's worst incident ticket. In any tool, the rule is that each number must come from a report you can re-run, not a count you did by hand on a Friday. The reader will one day ask "where did this come from?", and "the same report as every month" is the answer that ends the conversation.
Three Sentences: What Changed, Why, and What You Are Doing
Underneath the numbers come three sentences, and the first says what changed. Look at the five numbers and find the one that moved. And write the movement in words: "The backlog grew from 110 to 138, and almost all of the growth is tickets waiting on the housing management system's supplier." One number, one direction, one plain cause of the shape. If two moved, pick the one that matters more to the organisation, and mention the other in a clause. If none moved, the first sentence is "Nothing changed this month that needs your attention". That is the most valuable sentence the report can carry. It lets the reader stop reading and still trust you.
The second sentence says why, honestly, in one clause. "Because the supplier's support queue is about three weeks deep and we cannot close those tickets until they answer." Not a paragraph of background, not the history of the contract, not a defence of the desk. The reader wants to know whether the cause is inside the organisation, outside it, or unknown, because those three answers lead to three different decisions. "We do not yet know why" is an acceptable second sentence. "Various factors" is not, because it is a sentence with the content removed.
The third sentence says what the desk is doing about it, with a date. "We have escalated with the supplier's account manager, and I will report the count of tickets waiting on them next month." An action, an owner, a time. This is the sentence that turns the page from a complaint into a report. It is the one that gets skipped when the writer is tired. The first two sentences feel like the news and the third feels like homework. The third is the news. The first two are the context for it.
Three sentences is a limit, not a target, and you will fight it every month. The fight is the editing. Each sentence should be under about twenty-five words. The test for the set is whether someone who is not you could read all three aloud in a meeting without stumbling. They should be understood by people who have never seen a ticket. If a sentence needs a second sentence to explain it, the first sentence was about the mechanism, and the mechanism goes in the appendix or nowhere.
The One Ask
Either the desk needs something from the reader this month or it does not, and the page says which, in those terms. The ask is one of four things: approve something, decide between two things, accept a risk on the record, or nothing this month. It is specific, sized and dated. For example: "approve four days of Priya's time in the second week of next month to clear the thirty-one tickets older than thirty days". It does not say "we need more resource for the backlog". Hours are the currency, since hours are what the desk can count and what the reader can give.
The ask connects to a number on the page, and the page says which. An ask with no number behind it is a wish; a number with no ask attached to it is trivia. Suppose the backlog number is up and the ask is for the days to clear it. In that case, the reader can see the whole argument in one glance from the tile to the box. Most approvals happen in that glance. The ask may be bigger than a line: more people's time, money, a change to how a department works. In that case, the report carries the headline and the case gets its own page. That could be the hours-and-ranges one-pager in Presenting Support Economics, or the capacity sum that a headcount case is built on. The monthly report is where an ask is first seen. It is not where the case is made.
When there is nothing to decide, write "Nothing to decide this month" in the box, in those words, rather than leaving it empty. An empty box reads as an omission; the sentence reads as a judgement, which it is. The box earns its credibility by being sometimes full and sometimes not. A reader who has seen it say "nothing" for three months will act fast in the fourth. They have learned that you do not ask idly. (A box that is full every month teaches the opposite lesson, and the reader learns it just as quickly.)
The reply you want is "approved", or "let's talk on Thursday", or "no, and here is why". The reply you do not want is "thanks". If an ask gets "thanks", it was not written as an ask. It was written as information with a hopeful tone. In that case, the fix is to rewrite it with a verb, a quantity and a date and send it again on its own.
What to Leave Out
Per-technician numbers stay inside the team. Tickets closed by each person, time to resolve by each person, satisfaction by each person: these are coaching numbers. They are useful to the desk lead with a minimum sample and a conversation attached. They are not useful to anyone above, who cannot act on them and may act on them anyway. Which numbers go up and which stay on the desk is the whole subject of The Numbers to Show and the Numbers to Keep. The short version is that a leadership page never names a technician beside a number.
The table of tickets by category by week stays out, along with its cousins: tickets by channel, by department, by hour of the day. The desk reads those tables to find patterns. The patterns, once found, become a sentence on the page ("a third of this month's tickets were about the new expenses system"). The table itself answers no leadership question. Dashboard screenshots stay out, because a dashboard shows now and a report shows a month. A picture of Tuesday's queue pasted into a page about April is a decoration. Averages standing alone stay out, for the reason given above. And the explanation of mechanisms stays out: why the shared drive failed is for the incident review. That it failed, for whom, for how long, is for the page.
Leave out the list of everything the desk did. The temptation is strong, because the list is the proof that the month was hard, and the writer wants it seen. The volume number already says the month was hard. A report that reads as a timesheet is read as one, which is to say skimmed for the total and closed. The eleven pages were not wrong. They were addressed to the wrong reader, which is the same thing as being wrong, with more effort.
Everything that comes off the leadership page goes onto the desk's own scorecard, and nothing goes onto the leadership page just because it is on the scorecard. Where the page needs a picture at all, which is rarely, the choice is between three charts and the rest are traps. That is the subject of Charts That Help and Charts That Hide.
Remember: the report is one page. It has the same five numbers every month and last month's beside them. It has three sentences on what changed, why, and what the desk is doing by when. And it has one ask with a date, or the words "nothing to decide this month". If it cannot be read in two minutes, it will not be read.
The Page, Laid Out
The page reads from the top down in the order the reader's questions arrive. A header with the month. The five numbers in a row, each with last month beside it, so the eye can sweep across and find the one that moved. The three sentences in a block below them, which is where the reader slows down. The ask in a box that looks different from everything else on the page, because it is the only thing on the page that needs them. A one-line note on where the numbers came from, for the reader who asks. The picture below is Ashgrove's page with the worked-example figures from above. A side column shows the question each number answers and what has been kept off the page on purpose.
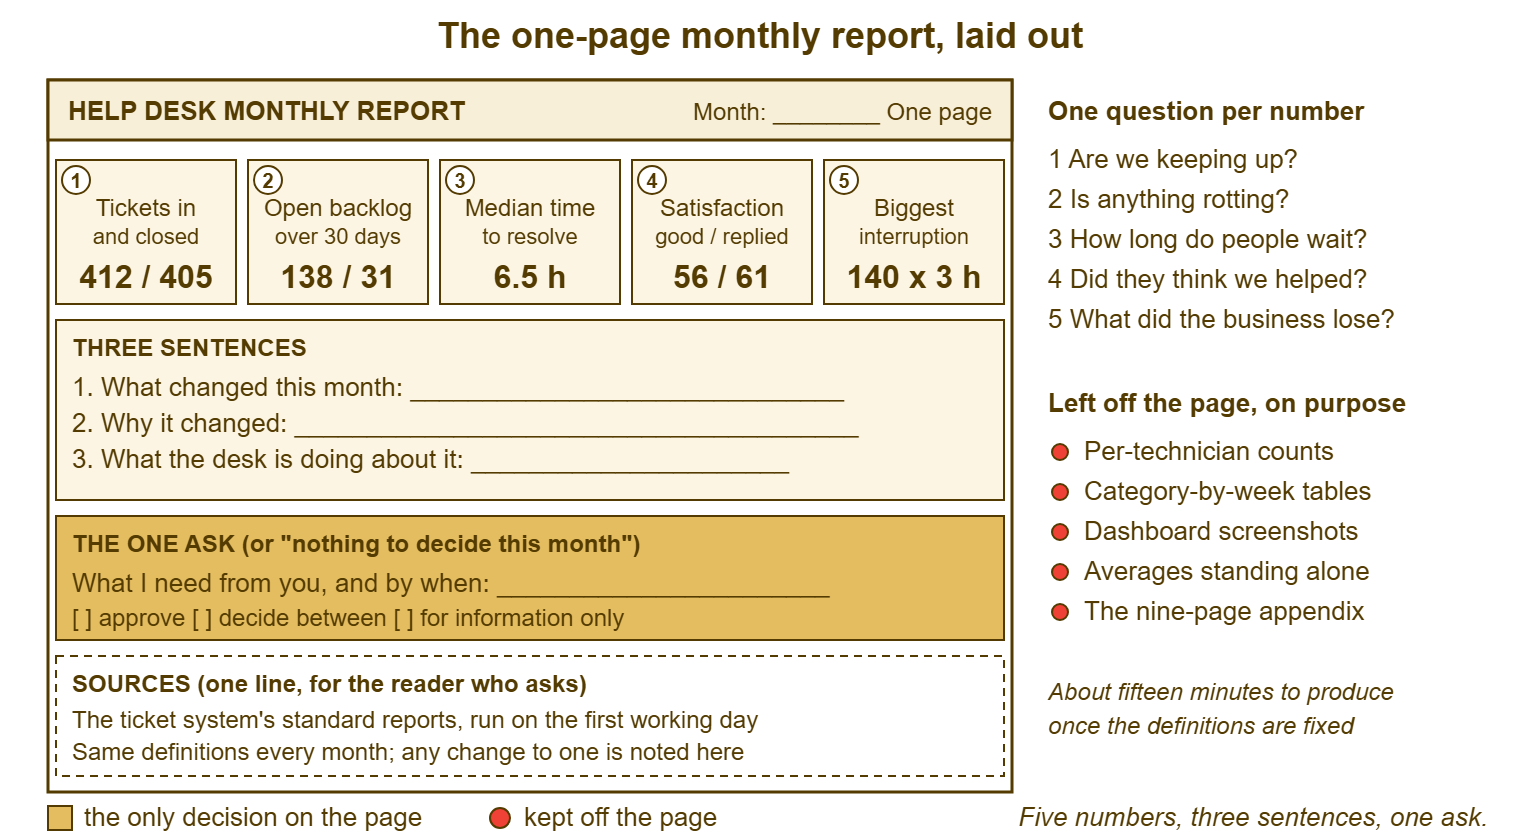
The ask is the only block in a different colour, so that a reader scanning the page finds the one thing that needs them without reading anything else. The sources line is small and never dropped, because the month a number is questioned is the month the line pays for itself. The side column is not printed; it is the editor's list, and it stays beside you when you write.
Send the page as the body of the e-mail, not as an attachment. An attachment is a second click. And the reader has two minutes; paste the page into the message so that it is read in the same glance as the subject line. Make the subject line carry the first sentence: "Help desk, April: backlog up to 138 on supplier delays, no decision needed". A reader who reads only subject lines, and some do, now knows the month. The attachment is where reports go to be filed, which is a polite word for lost.
Producing It in Fifteen Minutes
The fifteen minutes is real, and it is only real because the definitions are fixed and the reports are standard. On the first working day of the month, run the same four reports as last month. Read the five figures off them. Type them into this month's column and move last month's into the column beside. That is five minutes, and if it is more, something is being worked out by hand that should be a saved report. The first time, it is longer, because you are also deciding what each number means; Dana's first one-page report took forty minutes and her third took twelve.
The three sentences are the other ten minutes and they are where the thinking lives. Look at the five numbers with last month's beside them and ask which moved; the first sentence writes itself from the answer. The second sentence usually needs one look at the tickets behind the number: the backlog grew. So open the thirty-day list and see what it is waiting on. The third sentence you already know, because it is the thing you were going to do about it anyway. The ask you already know too, for the same reason; it is the e-mail you were going to send on its own.
Keep a running note through the month, because the first working day is the wrong day to reconstruct the month. When the shared drive goes down for three hours with 140 people on it, write "shared drive, Tuesday, about 3 h, about 140 people" in the note that afternoon. Do that while the incident ticket is open and the number of affected people is known. By the first of the month that fact is a sentence; without the note it is an hour of searching the ticket history. Two lines a week in a running note is the difference between a fifteen-minute report and a two-hour one.
Where the tool cannot give a figure directly, the spreadsheet can. In that case, the method belongs in the sources line so that it is the same every month. The median of resolution time is the month's resolved tickets exported, sorted by time to resolve, and the middle value read off. The thirty-day count is the open tickets exported and the rows counted where the created date is more than thirty days before the first of the month. Ten minutes once to set up, two minutes a month after. The tool-neutral rule is the same whatever you use. A number on the page is one you could produce again, the same way, next month.
Sending It, and Reading What Comes Back
Send it on the same day every month, and time it to the meeting it feeds. If leadership has a monthly meeting on the second Tuesday, the page arrives on the preceding Thursday, so that the sentence about the desk in that meeting is yours. If there is no such meeting, send it on the first or second working day, every month, without exception, including the months when nothing happened. The regularity is part of the message. A page that arrives like clockwork says the desk is in control of its own numbers before a word is read.
The reply tells you whether the page worked, and there are four kinds. "Thanks" is fine when the ask said nothing to decide, and a failure when it did not. A question is the best reply: the page made the reader think, and the question is answered in two lines by return. If the same question comes two months running, it becomes a number or a sentence on the page. A question asked twice is a reader telling you what they need. "Can you add..." is the fourth kind, and it is the trap. Every report receives, in about its third month, a request for one more chart. The chart is never removed. Reports do not shrink on their own; they are only ever cut.
Answer "can you add" with a one-off, not a section. Send tickets by department this month as a reply, with a line saying what it shows, and leave the page alone. If they want it every month, something else comes off the page to make room, and the trade is discussed rather than the addition assumed. The page is one page because it is read, and it is read because it is one page.
Two things change over time without changing the format. When the numbers are bad, the five tiles stay and the sentences get harder to write. In that case, the honesty of the writing is what the reader will remember. That is the subject of When the Numbers Are Bad. And after a year, twelve monthly pages laid side by side are a trend. The trend is a different document with a different question: the quarterly review, which closes this series. The monthly page does not try to be either of those. It is a page about a month.
A Short War Story: The Nine-Page Report at Tollgate Foods
At Tollgate Foods, a food distributor with six depots, a desk lead called Owen produced a nine-page monthly report for the operations director. For a year and a half, Owen built each report from the ticketing tool's report pack. The director filed each one unread in a folder named after the desk. In the month a warehouse scanner rollout went badly, the backlog doubled from about ninety tickets to about 180. Nearly all of those tickets were from depot staff unable to scan. The figure appeared where it had always appeared, in a table on page six. Nobody above the desk knew for seven weeks, until two depot managers raised it in the director's own operations meeting. The director asked Owen, in front of them, why he had not been told. Owen pointed to page six, which was accurate and had been since the month it happened. The cost, by the desk's own later count, was about seven weeks of depot staff working around broken scanners. That was somewhere between two hundred and three hundred hours of their time. The cost also included a director who for the following year asked for the desk's numbers in person rather than trusting a document from it. A number on page six is a number nobody was told.
The One-Page Monthly Report
The template below is the page, as plain text, so that it can be pasted into an e-mail body in any mail tool. Fill in the five numbers from the same reports each month, write the three sentences last, and tick exactly one box in the ask. The sources section is two lines and is never removed. The final line is the subject line of the e-mail, which is the first sentence shortened. The subject line is the part of the report that every reader reads.
HELP DESK MONTHLY REPORT — ONE PAGE
Month: ____________   Prepared by: ______________   Sent on: ____________

THE FIVE NUMBERS                              This month     Last month
  1. Tickets in / tickets closed ........... ____ / ____    ____ / ____
  2. Open backlog / older than 30 days ..... ____ / ____    ____ / ____
  3. Median time to resolve (business hours) ____           ____
  4. Satisfaction: good ratings / replies .. ____ / ____    ____ / ____
  5. Biggest interruption this month:
       people affected x hours lost ........ ____ x ____    ____ x ____
       what it was (six words) ............. ___________________________

THREE SENTENCES
  1. What changed: ____________________________________________________
  2. Why: _____________________________________________________________
  3. What the desk is doing about it, and by when: ____________________

THE ONE ASK (tick one)
  [ ] Nothing to decide this month
  [ ] Approve: _________________________________________ by ____________
  [ ] Decide between: ____________________ and ____________________
      by ____________
  [ ] Accept this risk, on the record: ________________________________
  The number on this page it relates to: ____

SOURCES
  Reports run on ____________ from the ticket system.
  Definitions unchanged since ____________ / changed this month: ________

SUBJECT LINE OF THE E-MAIL
  Help desk, [month]: [sentence 1, shortened to one line]
Dana sent her first one-page report the following month, pasted into the e-mail. It had "backlog up to 138 on supplier delays; one ask" in the subject line. There was a request for four days of Priya's time in the box. Mark replied in six minutes: "Approved. Is the supplier thing going to get worse?" It was a question, which meant the page had been read, and it was answered in two lines. Nine reports had asked Mark nothing. The tenth asked him one thing, and he said yes before his coffee was cold.
Frequently Asked Questions
Our leadership says they want more detail than one page. What then?
We have no satisfaction survey yet. What goes in the fourth slot?
Should the report show performance against service-level targets?
What goes in the "biggest interruption" slot in a quiet month?
Several leaders see the report. Do they each get a version?
A definition changed this month, or we migrated tools. How do I avoid a false jump?
From the QuerySolv team: we build self-hosted help desk software for Windows. QuerySolv runs as one Windows service on your own network. It takes requests by web form, e-mail, live chat, social messages and REST API. It is licensed once per installation rather than per agent per month. The free trial runs the full product for 30 days.