
How a Ticket Mountain Forms, One Quiet Week at a Time
Dev took over the queue on a Monday. The handover was a login, a sticky note with the mail server's name on it, and the sentence "it's mostly under control." The ticket list opened on the newest tickets, as ticket lists do. The first screen looked fine: a password reset, a printer, a laptop for a new starter. Then Dev scrolled. The list kept going. Somewhere past the two-hundredth row the subjects changed from problems to apologies ("sorry to chase this again"). Near the bottom was ticket 7719, a request for a second monitor, raised by someone who had since left the company, changed careers, and come back.
Nobody at that desk had decided to have four hundred open tickets. Nobody ever does. The count beside the filter said 412, and 412 is not a number anyone chooses. It is a number that happens to a desk while everyone in it is busy.
A backlog is the set of tickets the desk has accepted and not yet finished. That means every open request, whatever its status, that is not being actively worked at this moment. Some backlog is normal; a desk with no open tickets at five o'clock is either very small or closing things it should not. A ticket mountain is the backlog once it has grown past the point where anyone can hold it in their head. This article is about how it gets there. It is part of our Backlog Recovery series, which covers the dig-out, the careful declaration of ticket bankruptcy, the habits that keep the pile from coming back, and the one-page brief for management.
It covers the arithmetic of inflow and outflow, then the quiet year in which the mountain forms. Then it asks where the extra tickets come from. The aging curve and what its shape tells you follow. Next come why the mountain is invisible from inside the desk and the three numbers that measure a backlog. How to read a created-versus-solved chart, the four shapes a backlog takes, and a measurement sheet to copy come last, in that order.
Inflow, Outflow and the Gap
A backlog is arithmetic before it is anything else. Tickets arrive at some rate, which I will call inflow: the number of new tickets the desk receives in a day or a week. Tickets leave at another rate, outflow: the number the desk resolves or closes in the same period. If outflow matches inflow, the number of open tickets stays where it is. If outflow is higher, the pile shrinks. If inflow is higher, by any amount, for long enough, you get a mountain. That is the whole mechanism, and everything else in this article is about why it is so hard to see.
The gap does not need to be large. A desk that receives thirty-four tickets a day and closes thirty-one has a gap of three. Three a day sounds like a rounding error. Nobody will notice it on a Tuesday. Over a working week it is fifteen tickets, which still looks like a slow Friday. Over a quarter it is close to two hundred, and over a year it is seven hundred and fifty, minus whatever the requesters gave up on. The gap is small. The year is long.
What makes the gap persistent is that nothing in a normal day pushes back on it. A technician who closes thirty-one tickets has had a full day and goes home tired, having done good work. The three that were not closed are not anyone's failure; they are simply the three that did not fit. Tomorrow, thirty-four more arrive, the newest ones get looked at first because they are at the top, and three more slide down. The backlog is not built by bad days. It is built by ordinary days, stacked.
Desks also mistake a balanced week for a balanced desk. Created and solved can match for a week and the backlog still be enormous, because the pile is the sum of every past week's gap, not this week's. Matching inflow this week means the mountain stopped growing. It does not mean it got smaller. A balanced week is a mountain that has decided to stay the height it is.
The Quiet Year
Mountains form in quiet, not in crisis. A crisis produces a visible spike, and visible spikes get attention. Examples are the outage week, the office move, and the day the mail filter broke and a thousand messages became a thousand tickets. Those get a plan, a late evening or two, and a manager asking how it is going. The spike is cleared. What does not get cleared is the slow leak underneath it, which was there before the spike and is still there after.
Here is what the quiet year looks like at Acme, a desk of three. In the first month, the oldest open ticket is twelve days old and the open count hovers around sixty. That is a healthy desk. In month three, the count is around a hundred and ten, and the oldest ticket is six weeks old. It is a software request waiting on a budget holder and everyone knows about it. So it does not worry anyone. In month six the count is two hundred and the oldest ticket is older than the newest technician's employment. By month nine, the team has stopped scrolling to the bottom. By month twelve, the count is 412. Nobody can say what the oldest ticket is without looking. A new manager has asked for "a quick summary of where we are with the backlog".
Notice what did not happen. Nobody got slower. Inflow did not double. No single week was a disaster. The desk closed thirty-one a day in month one and thirty-one a day in month twelve, and was praised in between for a stable closed count. The closed count was indeed stable. (So was the gap.)
The other thing that happens during the quiet year is that the backlog starts to feed itself. Old tickets generate chasers, "any update on this?", and each chaser is a reply that needs reading and often a reply that needs writing. That is time not spent closing. Requesters who got no answer raise the same problem again, so one unanswered ticket becomes two. Technicians avoid the old ones because the old ones are embarrassing, and pick the fresh ones because the fresh ones are quick. Every one of those behaviours is reasonable. Together they turn a leak into a current.
Where the Extra Tickets Come From
The three a day are not random; they come from a few specific places, and knowing the places is most of the diagnosis. The first is the unassigned ticket. A ticket arrives, is not claimed, and sits in the shared view where it belongs to everyone, which is the same as belonging to nobody. Every technician assumes someone else has it. In many tools a breached deadline on an unassigned ticket alerts nobody, because there is nobody to alert. So a ticket that nobody claimed can pass its target in silence. Check what yours does with a test ticket left unassigned past its target. Most tools can also show unassigned work as a view of its own, with a count beside it, but a view has to be looked at.
The second is the ticket waiting on the requester. The technician asked a question, set the status to Awaiting Reply, and moved on. The requester never answered, because the problem went away, or because they fixed it themselves, or because they did not understand the question. The ticket is still open. It will be open in a year unless someone has a rule for how long a desk waits before closing, and most desks do not. The follow-up discipline that stops this is a subject of its own in What Ticket Age Actually Measures. Here, it is enough to say that Awaiting Reply is the status where tickets go to live quietly.
The third is the ticket waiting on someone outside the desk: a supplier, a budget holder, another team, a part. The desk cannot finish it, so the desk stops looking at it, and the thing it is waiting for never arrives because nobody chased. The fourth is the project disguised as a ticket: "set up the new office", "migrate the finance share", "sort out the printers". A ticket with eleven tasks in it does not close when one of them is done, so it never closes at all.
The fifth is the resolved ticket nobody closed. The fix was made, and the requester was told. The ticket sits at Resolved because the desk's workflow asks the requester to confirm, and requesters do not confirm things. The sixth is the hero's drawer. These are the hard tickets that always go to the one person who could fix them. That person will do that as soon as they have a free afternoon, which is never. Six sources, and I have yet to meet a backlog that did not draw on at least four of them.
The Aging Curve
The useful picture of a backlog is not its size but its age. Ticket age is how long a ticket has been open, counted from the moment it was created. An age band is a bucket of ages: zero to seven days, eight to thirty, thirty-one to ninety, over ninety. Sort the open tickets into bands and count each band, and you have the aging curve: the shape of the backlog over time.
A healthy desk's curve is a slope that falls steeply. Most open tickets are in the first band, because most tickets are new and most get closed within a week. A smaller number are in the second band, waiting on a part or a person. A handful are in the third. The fourth band is empty, or holds two or three tickets everyone can name. Draw it and it looks like a ski slope: tall on the left, nearly flat on the right.
A ticket mountain's curve has a hump. The first band still looks healthy, because new tickets still arrive and still get the attention. So a glance at this week's numbers says nothing is wrong. The second band is a bit fat. The third is fatter. The fourth band, over ninety days, is the biggest of all, because tickets that reach it never leave. Nothing in the first band tells you about the fourth. That is why a desk can report "we answered nine tickets in ten inside a day this month" and have four hundred open tickets, and both statements are true.
Age also changes what a ticket is. A ticket at day two is a problem to solve. At day thirty it is a problem plus an apology. At day ninety it is an apology plus a question about whether the problem still exists, and the honest answer is usually that nobody knows. At day two hundred it is not a ticket any more. It is a record that the desk once received a request, which is a different thing and should be handled differently. The Dig-Out Plan treats the bands differently for exactly this reason.
Why the Mountain Is Invisible From Inside
The mountain is invisible from inside because the tools, the metrics and the habits all point at the new end of the queue. The ticket list opens on what changed most recently. The dashboard shows what is due this hour. The monthly report counts what was closed. Every one of those is useful, and none of them has a reason to mention ticket 7719, which has not changed, is not due, and was not closed. The oldest ticket on the desk is also the quietest.
Sorting order does most of the hiding. Most queues show the most recently updated ticket first, which is the right default for working the queue and the wrong default for seeing it. A ticket nobody touches sinks, and sinking is the one thing that guarantees nobody will touch it. Some tools let you sort the list by created date or save an "oldest first" view. Others offer one list in update order. In those tools, the oldest tickets sit at the bottom of a long scroll and the count by age has to come from a report or an export. Whatever your tool, find the place that counts by age. The list is for working. The report is for seeing.
The metrics hide the rest. "Tickets closed this month" is a measure of outflow with no memory. A desk that closed 620 tickets this month and received 680 reports a strong month. "Average time to resolve", computed on closed tickets, ignores every ticket that is not closed, which is to say it ignores the backlog by definition. A desk can produce twelve consecutive good monthly reports while building a mountain, and most mountains were built under exactly that kind of reporting. The report was never asked how many tickets were still open. Nobody wanted to know, and the report was polite enough not to say.
Habits do the last part. People open the queue, work the top of it, and close the queue. Scrolling to the bottom is not a task anyone is given, and it is not pleasant, because the bottom is where the apologies are. The one habit that makes a mountain visible is a weekly look at the oldest ticket and the count over thirty days, and it takes two minutes. Nobody skips it because it is hard. They skip it because nobody asked.
Measuring the Backlog by Three Numbers
Measure a backlog by three numbers, in this order: the count, the age distribution, and the oldest ticket. The count is the number of open tickets right now, in every status that is not Resolved or Closed. The age distribution is the count split into age bands. The oldest ticket is one ticket number and its age in days. Each number corrects the one before it, and together they fit on an index card.
The count on its own misleads, because four hundred open tickets of which three hundred and eighty are under a week old is a busy desk, not a mountain. The age distribution says which one you have. The oldest ticket keeps everyone honest, because an age distribution can say "forty tickets over ninety days" without anyone feeling it. And "ticket 7719, 341 days, second monitor, requester has been promoted twice" is a sentence people feel.
Getting the three numbers takes one export and one spreadsheet. Export the open tickets with their created date, status, assignee and subject. Add a column for age (today's date minus the created date, which every spreadsheet can do with a subtraction) and a column for band. The band formula below puts each ticket in one of four buckets. Adjust the cut-offs to taste, but keep four bands, because three hides the hump and six is a report nobody will read.
AGE AND BAND COLUMNS (spreadsheet)
Age in days:    =TODAY()-C2
Band:           =IF(D2<=7,"0-7",IF(D2<=30,"8-30",IF(D2<=90,"31-90","90+")))
Count per band: =COUNTIF(E:E,"90+")   (one per band, or a pivot on column E)
Oldest:         =MAX(D:D)   then find that row for the ticket number
Here C2 holds the created date, D2 the age and E the band column. Run it once and you will have the three numbers in twenty minutes; run it weekly and the second time takes five. Some tools produce the bands for you. Most ticketing tools can show backlog by age over the last week, month or quarter. Many add median and 90th-percentile resolution times beside it, which saves the spreadsheet for the count and the bands. If yours cannot, export and count. Either way, the oldest ticket is still worth finding by hand, because a bar on a chart does not have a requester's name on it.
Remember: a backlog is measured by count, age distribution and oldest ticket, never by the closed count alone. The closed count tells you how hard the desk worked. The age distribution tells you whether it is winning.
Reading a Created-Versus-Solved Chart
The one chart that shows a mountain forming is created versus solved. It has two lines, one for tickets created per week and one for tickets solved per week, drawn over the same months. If the lines cross back and forth, the desk is keeping up. If the created line sits above the solved line week after week, the space between them is the backlog being built. In that case, the size of the space is the rate it is being built at. Add a third series underneath showing the open count at the end of each week, and you can watch the gaps add up into a pile.
The picture below shows twelve weeks of a desk that nobody would have called in trouble. Created per week climbs gently from 150 to 178, which is the kind of growth a company has when it hires a few people. Solved per week stays between 140 and 154, which is what a team of the same size can do. The shaded gap between the lines is never more than twenty-four tickets in a week. The bars underneath show what twelve of those gaps add up to. They show an open backlog that goes from 50 tickets to 226 in three months without a single bad week.
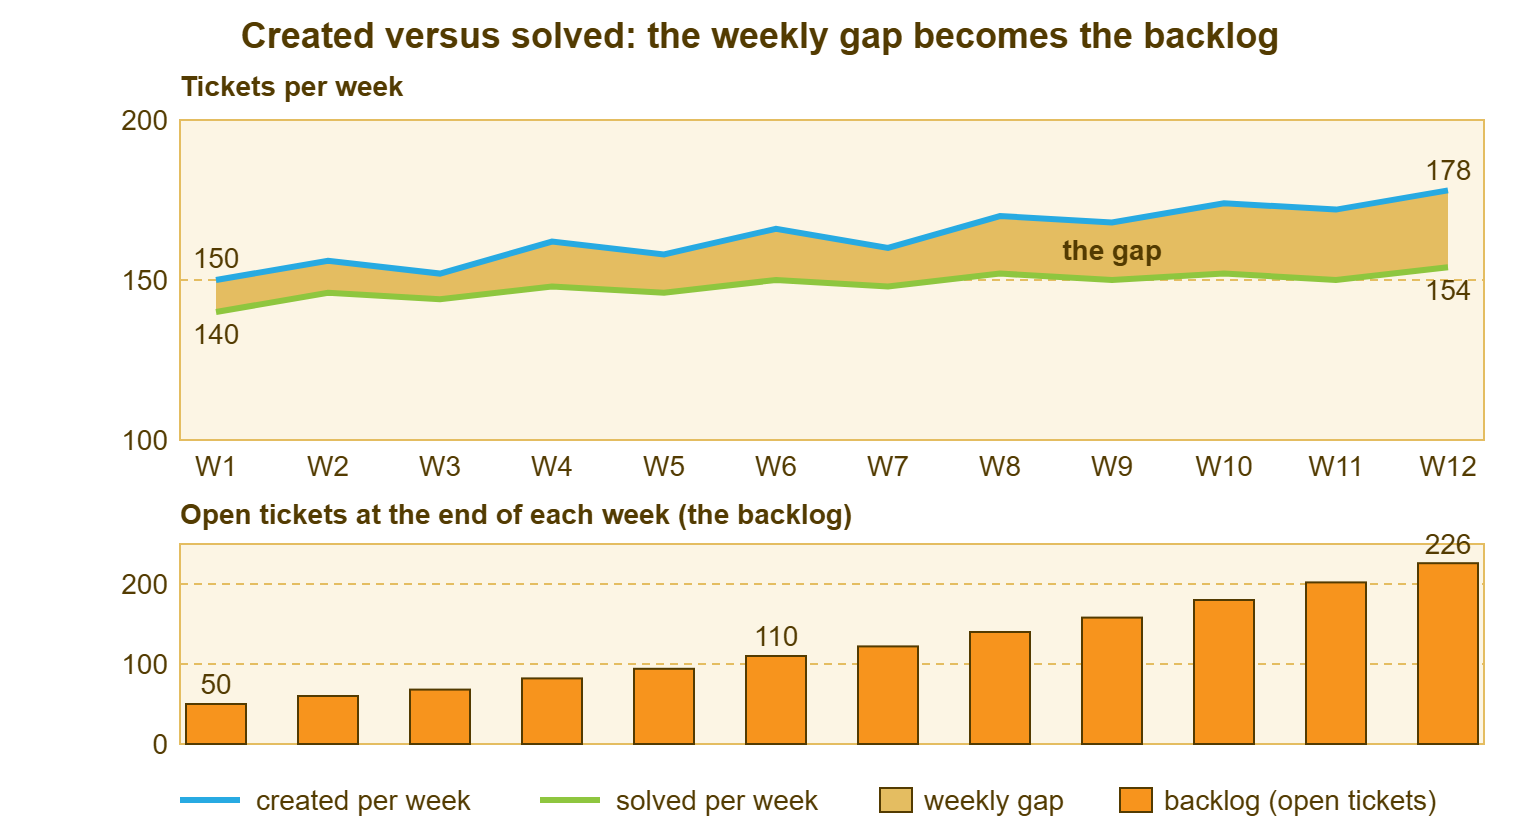
Three things in the chart are worth saying out loud. The solved line is flat, because a team of fixed size has a fixed capacity, and no amount of effort moves it for long. The created line only has to be slightly above it. And the bars never go down on their own, because nothing in the system removes an open ticket except a person closing it. The chart does not show a desk getting worse. It shows a desk staying exactly the same while the world around it grew by a few tickets a week.
Most ticketing tools can draw this chart over a week, a month or a quarter, or at least export the two weekly counts that make it. If yours does neither, two columns in a spreadsheet and a line chart take ten minutes. Whichever tool draws it, look at it monthly, and look at the gap rather than the lines. A gap that is positive for three months running is not a busy quarter. It is a forecast.
The Four Shapes a Backlog Takes
Backlogs come in four shapes, and the shape says what caused it and what will fix it. Read the created-versus-solved chart and the aging curve together and one of the four rows below will match. The table is a diagnosis aid; the plan that follows from the diagnosis is the subject of the next two articles in this series.
| Shape | What the chart shows | What the aging curve shows | Usual cause |
|---|---|---|---|
| The steady leak | Created slightly above solved every week for months | A hump in the 31-90 and 90+ bands, growing slowly | Capacity a little short of demand; no closing rule for Awaiting Reply and vendor waits |
| The step | A spike in created one week, then normal; solved never catches up | A block of tickets of nearly the same age, all old | An event (outage, migration, mail flood) that was never worked off; the desk absorbed it and moved on |
| The seasonal tide | Created rises and falls on a yearly rhythm; solved is flat | Humps at the ages of the last two peaks | Term starts, year-ends, audits, new-starter waves; capacity set for the average, not the peak |
| The hidden pile | Chart looks balanced; open count still high | Nearly everything in the 90+ band, little in between | A past backlog nobody dug out; the desk keeps up with today and carries the past on its back |
The hidden pile deserves a second look, because it is the shape most desks have without knowing. The chart is balanced, the dashboard is green, and this week's tickets are handled. Three hundred tickets from a bad year ago are still open, untouched, ageing in a band nobody reports on. A desk in this state is not behind. It is current, with a weight on its back. The weight will not shift until someone decides to shift it, which is what Taking Stock Before You Dig is about.
Two of the four are not really the desk's fault, and it is worth saying so to whoever asks. The step came from an event. The seasonal tide comes from the organisation's calendar. The desk can be blamed for not digging out afterwards, but not for the pile forming. A desk that knows which shape it has can say so in a sentence rather than an apology. Many of the habits that produce a hidden pile are the quiet failures described in The Seven Ways Support Quietly Fails. None of them involve anyone being lazy.
A Short War Story: Three a Day at Meridian Parts
Meridian Parts ran a two-person desk for a distribution business of about two hundred staff. For a year and a half its monthly report showed a closed count between 580 and 640. The operations director read that as consistent. During that time the open count went from 70 to 530. Nobody looked at it, because the report did not have a line for it. The desk found out when Ingrid, the new warehouse manager, asked why her predecessor's request for handheld scanner chargers, ticket 3382, was still open after fourteen months. She also asked whether that meant the chargers had been ordered or not. The answer took a day to find and was "not". The chargers had been bought twice in the meantime on a department card, because the warehouse had stopped waiting. The cost was two duplicate purchases, a director who stopped trusting the monthly report, and a dig-out that took the desk's evenings for most of a month. The lesson was not that the desk was slow. It was that a closed count with no open count beside it is half a report. The missing half was the half that mattered.
The report now has four lines: created, solved, open, and the oldest ticket. The director reads the last one first.
The Backlog Measurement Sheet
The sheet below is the three numbers and the chart, on one page, filled in monthly. Use it before any dig-out, so there is a before; keep filling it in after, so there is an after. It is plain text so it can live in the knowledge base or on the wall. The shape line near the bottom is the table above; circle one.
BACKLOG MEASUREMENT — ONE PAGE
Desk: __________________  Date: ______________  Measured by: ____________

THE COUNT
  Open tickets now (every status except Resolved and Closed): ____
  Of which unassigned: ____    Awaiting Reply: ____    On Hold: ____
  Same count one month ago: ____    Three months ago: ____

THE AGE DISTRIBUTION
  0-7 days:   ____    8-30 days:  ____
  31-90 days: ____    Over 90:    ____
  Over 90 as a share of all open: ____%

THE OLDEST TICKET
  Number: ________   Age in days: ____   Subject: ______________________
  Requester still here?  [ ] yes  [ ] no    Still needed?  [ ] yes [ ] no [ ] unknown
  Next five oldest (numbers): ______ ______ ______ ______ ______

INFLOW AND OUTFLOW (last four weeks)
  Created per week:  ____  ____  ____  ____     Average: ____
  Solved per week:   ____  ____  ____  ____     Average: ____
  Weekly gap (created minus solved): ____
  At this gap, the backlog grows by about ____ a month

THE SHAPE (circle one)
  steady leak  /  step  /  seasonal tide  /  hidden pile
  Evidence: _____________________________________________________

ONE SENTENCE FOR MANAGEMENT
  _______________________________________________________________
Fill the sheet in before you tell anyone the number. That is because the first question after "we have 412 open tickets" is "how old are they?", and the second is "how did that happen?" The sheet answers both. The one-sentence line at the bottom is the hardest field and the most useful. "We receive four more tickets a week than we close, and have done for a year" is a sentence a director can act on. "The backlog is quite high" is not.
The number at Dev's desk was 412. A month later, after the sheet, it was still 412, because measuring a thing does not change it. But the sheet said the desk had a hidden pile and a small steady leak. It said that 280 of the 412 were over ninety days old, and that the oldest requester had left and come back. Those facts turned a number into a plan. The mountain had taken a year to form, three a day, quietly. It took one afternoon to see.
Frequently Asked Questions
Does the backlog include tickets that are On Hold or Awaiting Reply?
What is a normal number of open tickets for a small desk?
Our tool only shows the open count. How do I get the age bands?
Should the count include Resolved tickets waiting for the requester to confirm?
How often should the backlog be measured?
Is a growing backlog always a capacity problem?
From the QuerySolv team: we build self-hosted help desk software for Windows. QuerySolv runs as one Windows service on your own network. It takes requests by web form, e-mail, live chat, social messages and REST API. It is licensed once per installation rather than per agent per month. The free trial runs the full product for 30 days.