
Planning a Year Ahead: The Support Capacity Plan
Thursday, 17:50, the car park at Redbrook Engineering. Ben, who runs the three-person desk, is unlocking his car. The head of engineering, two spaces along, says over the roof of hers: "You're all set for the graduates, I assume? Thirty-eight of them, first Monday in September." It is the second week of August. Ben has heard nothing about thirty-eight graduates. The hiring plan that contains them, it turns out, has existed since February and has been through three budget rounds. It was copied to everyone who needed to know. That did not include the people who would build thirty-eight laptops and create thirty-eight accounts. They would also answer thirty-eight people's first-week questions in a month when one technician is on leave. Ben drives home doing arithmetic. The arithmetic is not good.
A support capacity plan is a one-page statement covering the next twelve months by quarter. It says how much work the desk expects, how many hours it will have, and where the gap opens. It also says which lever it will pull before the gap opens. It is built from the organisation's own growth forecast, which HR has and the desk usually does not. The plan is wrong by March every year, which is not a reason to skip it. The plan is not a prophecy. It is a set of dated triggers, agreed in advance with the people who hold the budget. That makes the thirty-eight graduates a line in a plan rather than a sentence over a car roof. This article is part of our Scaling Support Through Growth series. This is the last article, because it is how the other five are made to happen on time.
It covers why a year is worth planning when everything changes, then starting from HR's growth forecast and what to ask for. Next come translating starters into onboarding hours and translating headcount into ticket volume. Then comes the quarterly grid of hours needed against hours available, with the three levers drawn against it. The article covers choosing the lever for each gap, the budget conversation in hours, and the quarterly review of the plan. It finishes with what the plan is not, a short war story, and the annual capacity plan to copy, in that order.
Why Plan a Year When Everything Changes
The plan is worth making because the levers are slow and the growth is not. A hire takes four to eight months from decision to productive technician. A tool takes a quarter to choose and settle; even a process takes a month to become a habit. Growth, by contrast, arrives on a Monday in September. A desk may wait to see the gap before acting on it. In that case, it will be at the gap for the length of the lever's lead time. The series article on When to Add Heads is mostly about the cost of those months. The plan exists to start the lever moving before the gap, which is the only time it is cheap.
The plan is also worth making because it will be wrong, and being wrong in writing is how a desk learns what it did not know. The forecast method this article rests on uses base, season, growth and known events. It is owned by Forecasting Volume Simply. Its central rule applies here: every number is a range, the range is honest, and the plan says what it rests on. A plan with a quarter that turned out a fifth too high is a plan with a lesson in it. A plan that was never written has no quarters and no lessons, only Septembers.
Start From HR's Growth Forecast
The desk does not own the growth forecast; HR and finance do. And the first job of the plan is to go and ask for it. Ask in the autumn, when next year's budget is being set, and ask for four things. Ask for planned starters by quarter, by department and by site. Ask for planned leavers, or the usual turnover if nobody plans leavers. Ask whoever runs projects for the projects and systems coming in the year. Ask about any site opening, closing or moving. Most organisations have all four somewhere. The conversation that gets them is short once HR understands why the desk wants them. The sentence that explains it is "every starter is about three hours of our work in their first fortnight, so your plan is our plan".
Expect the forecast to be a range and treat it as one. "Thirty to forty-five in the second half, mostly engineering" is a usable forecast; "we'll see how the year goes" is a request to come back in a month with a number from last year. Where HR genuinely has nothing, use last year's starters and leavers by quarter as the base and say so on the plan. The point is not precision. The point is a shared picture of the year, with the people who will be surprised when the desk is not ready. The desk is working from that same picture, and the picture has a date on it.
Ask once a quarter after that, not once a year, because the forecast moves. The claims team that was planned for the second quarter slips to the third. The acquisition that was not planned at all closes in May. A ten-minute conversation each quarter with the person who holds the hiring plan is the cheapest capacity management a desk can do. It also makes the desk the department that asked, which is a reputation worth having in a budget round. (It is also, in my experience, the only department that asked.)
Translate Starters Into Onboarding Hours
Each starter is a known quantity of desk work, and the desk can measure it from its own tickets rather than guess. An onboarding can be done as a set of linked tickets the way Onboarding as a Ticket Type describes it. That onboarding has a hands-on time for the account, the device build, the delivery and the first-day setup. It also has a tail: the first fortnight's questions from someone who does not yet know where anything is. At Redbrook, sampled across twenty onboardings, the set came to between two and a half and four hours per starter including the tail. Engineers were at the top of the range because of the design software. Thirty-eight graduates in one month is therefore somewhere between ninety-five and a hundred and fifty hours. That is most of one technician for the month, in a month with one technician on leave.
The timing matters as much as the total, because onboarding work arrives in two lumps. The build and the account can be done before the start date if the desk knows the start date. That is the whole argument of Getting the Request Before the Start Date. The tail cannot be moved and lands in the first fortnight. A plan that knows about September in February can build thirty-eight laptops across the summer, two a week, and face September with only the tail. A desk that learns about September in August faces both lumps at once, in the leave month. Leavers are smaller work and the same shape. The article The Offboarding Checklist is where their hours come from. Put them on the same line of the plan, because a replacement hire is a leaver and a starter three months apart.
Translate Headcount Into Ticket Volume
The steady-state volume rises with headcount. The number that carries it is tickets per hundred staff per month, the second base the forecasting article tells every desk to keep. Redbrook's twelve-month base was about a hundred and sixty tickets per hundred staff. So a hundred and ninety staff produce about three hundred a month. Two hundred and twenty-five will produce about three hundred and sixty, give or take the season. The season comes from last year's shape, with its September bump for starters and its August dip. And the known events are the projects list. A new design system going live in the third quarter at Redbrook meant a spike of its own. The hotspot and problem articles in this library would later spend a quarter reducing that spike. The plan simply had to expect it.
Keep the per-head base honest by watching what else changes. A new system raises it. A self-service reset project lowers it. A merger brings a workforce with a different base entirely. The right move then is to measure the new group's base separately for a quarter rather than assume it matches. The reading of trend against season, so that a growth line is not mistaken for a busy quarter, is in Trends and Seasonality. The plan takes the growth line from there rather than recomputing it. Tickets become hours by the sampled median, as in the capacity check, and the hours go on the grid.
Hours Needed Against Hours Available, by Quarter
The grid is the plan: one row per quarter, with staff, starters, forecast tickets, hours needed, hours available, the gap, and the lever. Hours available come from the real calendar, with leave and the projects the desk has already been given taken off. So the third quarter at Redbrook is lower than the first because August is in it. Hours needed are the ticket hours plus the onboarding hours plus the known events, each as a range. The gap is the difference, and the quarter in which it first exceeds the slack is the quarter the plan exists for. Redbrook's grid is below, in round figures, with the ranges collapsed to their middles for the sake of the table. The ranges are kept in full on the plan itself.
| Quarter | Staff at end | Starters / leavers | Tickets a month | Hours needed a month | Hours available a month | Gap | Lever |
|---|---|---|---|---|---|---|---|
| Q1 | 193 | 5 / 2 | about 300 | about 240 (225 tickets, 15 onboarding) | about 345 | slack of about 100 | Process: onboarding requested before the start date; builds done ahead |
| Q2 | 198 | 7 / 2 | about 310 | about 255 (235 tickets, 20 onboarding) | about 340 | slack of about 85 | Tool: the design-system knowledge base written before go-live; advert for a fourth technician out |
| Q3 | 236 | 42 / 4 | about 350 rising to 370 | about 400 (275 tickets, 85 onboarding, 40 go-live) | about 290 (August leave) | short by about 110 | Heads: fourth technician starts in August; summer builds absorb the lump |
| Q4 | 240 | 8 / 4 | about 370 | about 320 (280 tickets, 25 onboarding, 15 go-live tail) | about 455 (four technicians) | slack of about 135 | Restart the prevention hour and the problem review on the go-live tickets |
The picture below is the same grid drawn as two lines. One shows the hours the tickets need, rising through the year. The other shows the hours the desk has, stepping up each time a lever is pulled. The three levers are marked where they act, with what each buys and what each cannot do. Where the rising line runs above the stepped one, the backlog grows, and the shaded gap is the cost of pulling a lever late. At Redbrook the process lever in the first quarter and the tool lever in the second each buy some hours. Neither closes a third-quarter gap of a hundred hours a month, which is a person's size. The plan says so in the second quarter, which is when the advert goes out.
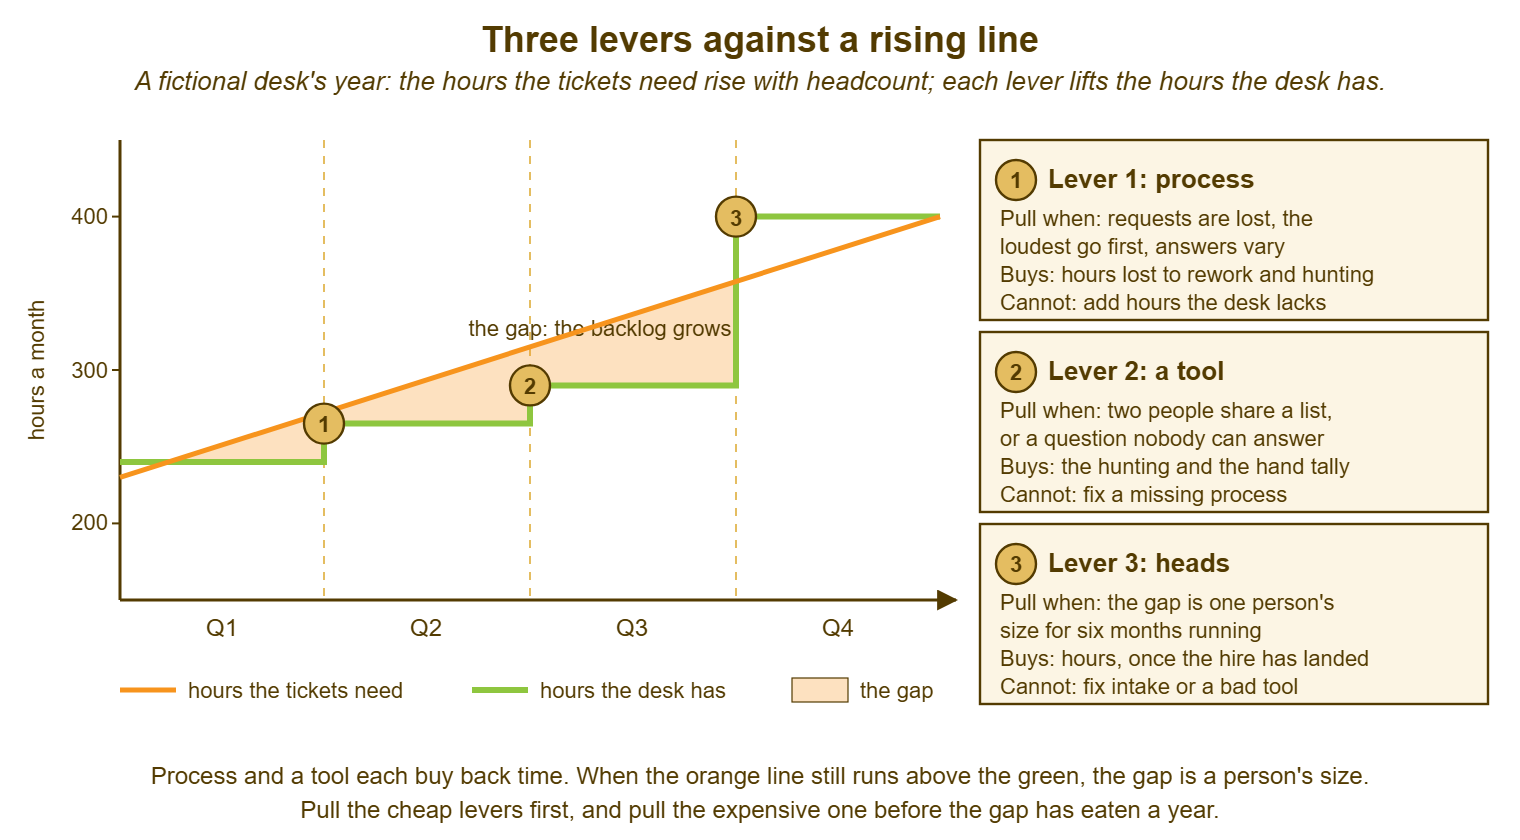
Read the gap column for its shape, not only its size. A gap that opens in one quarter and closes in the next is a lump, and lumps are met with preparation, cover and timing, not hires. A gap that opens and stays open, because the headcount that caused it stays, is a person. The person has to be asked for in the quarter before the gap, which at Redbrook was the second. The grid makes that visible in February, which is six months earlier than the car park.
Choosing the Lever for Each Gap
Each lever has a lead time and a limit, and the plan matches the lever to the gap by both. Process is fastest, weeks from decision to habit. It buys back the hours the desk loses to rework, hunting and the loudest-first argument. It cannot add hours the desk does not have. The ladder of what to add at each stage is in When to Add Process, and How Much. A tool takes a quarter, from the trigger through the fair trial to the settled queue. It buys the hand tally and the hunting. It cannot fix a missing process, and its triggers are in When to Add Tools, and When Not To. A head takes half a year and buys hours, once the hire has landed and learned the desk. It cannot fix intake or a bad tool. The signals that say the gap is real are in the capacity article.
Pull the cheap levers first, in the quarters of slack, so that the expensive one is asked for on a desk that has already done everything else. Redbrook's first-quarter process, onboarding requested before the start date, with builds done in the summer, took the September lump from both-at-once to tail-only. Its second-quarter tool was the knowledge base for the new design system, written before go-live, with the articles visible to everyone. That took the go-live spike from a hundred tickets to sixty. Neither closed the third quarter. Both made the ask for the fourth technician a short conversation. The finance director could see the two cheaper levers already pulled on the same page as the request.
Remember: the plan is a grid of quarters with a gap column and a lever column. Pull process in the quarters of slack and a tool in the quarter before it is needed. Ask for a head in the quarter before a gap that will not close. The lead time of the lever decides the quarter, not the size of the gap.
The Budget Conversation in Hours
Take the plan to the budget round in hours. Hours are what the desk can prove and money is what finance can attach to them in a minute. The page shows, by quarter, the hours the organisation's own growth will need from the desk and the hours the desk has. It shows the gap and the three asks. One ask is the process the desk will do itself at no cost. Another is the tool with its licence and its migration hours. The last is the head with its lead time. The way to present the economics so that a finance director reads them is the subject of Presenting Support Economics. The one-page headcount case is in The Headcount Case. These are the two formats the plan feeds. The plan is what makes both of them arrive before the crisis rather than during it.
The sentence that changes the conversation connects the desk's gap to the organisation's own decision. For example: "the thirty-eight graduates the plan hires in September are about a hundred and twenty hours of our work in that month, which is the month we are already short". The desk is not asking for growth. It is asking for the cost of the growth already approved. Most finance directors, shown that sum on one page, will fund it. The alternative is to have approved thirty-eight hires and no way to give them a laptop. Finance directors are not fond of surprises. Neither is anyone else, but finance directors have a budget line for them, and they would rather not use it.
The Quarterly Review of the Plan
The plan is reviewed once a quarter, in the same half hour as the growth stage card and the capacity check. The review has four steps. Compare the quarter's forecast with what happened: tickets, starters, hours, and the gap. Ask HR and the project office for the next four quarters again, because they have moved. Move the trigger dates: an advert brought forward, a tool trial pushed back, a process added that the queue has just asked for. Write one line in the monthly report that leadership reads. Use the form "the plan expected about three hundred and ten tickets a month this quarter and saw three hundred and thirty; the fourth technician's advert went out as planned". The quarterly review as a leadership conversation is owned by The Quarterly Review, and the plan is the page it is built around.
The actuals come from the standard reports, volume and backlog by age. Most help desk tools produce these, QuerySolv among them. So the review's first step is a comparison rather than a count. The forecast column was written in ranges. The actual column is a point. The question each quarter is whether the point fell inside the range, and when it did not, why. Three quarters of actuals outside the range in the same direction mean the base has changed. In that case, the fourth quarter's plan is rebuilt from the new base rather than patched. One quarter outside is a lesson, and the lesson goes on the plan in a sentence.
What the Plan Is Not
The plan is not a promise of a hire, and it should say so. It is a set of triggers with dates, and a trigger that fires is a request, with a case behind it, not an entitlement. A desk that treats the plan's third-quarter head as agreed will be surprised. A finance director who treats the plan as a bid will be defensive. The plan is the shared picture both of them look at when the trigger fires. Its value is that neither is surprised by the picture.
The plan is not a ratio. The plan implies a technician-to-staff figure, at Redbrook about one per sixty rising to one per eighty after the fourth hire. That figure is written on the plan for the desk's own tracking and compared with nothing but the desk's own earlier figure. No industry ratio fits every organisation, and the plan's hours are the argument. The plan is also not a forecast of the whole year's work. It covers the growth the organisation has told the desk about. The slack is for the outage, the audit, and the acquisition that closes in May. It is also for the merger that brings a workforce with a different base. And a plan that leaves no slack is a plan that has decided the year will go as planned, which no year has.
A Short War Story: The Claims Team at Stonebridge Insurance
Stonebridge Insurance hired a claims team of forty-four in the second quarter, in a new office on the floor above. Its four-person desk learned of the team when the first twelve arrived on a Monday without accounts. The hiring plan had been approved in the autumn and circulated to a list that did not include IT. The desk built laptops from the spares cupboard until it was empty on the Tuesday. It ordered more at a premium for delivery that week and created accounts by hand in the evenings. It spent the next three weeks on the new team's first-fortnight questions. Meanwhile, the ordinary queue aged past thirty days for the first time in two years. The desk lead, Nadia, counted a hundred and forty hours of after-hours work across the four of them in the month. The claims team's manager complained to the board that IT had "not been ready", which was true. The board's question to Nadia was why she had not planned for a team everyone had known about since October. Her answer, that nobody had told the desk, was accepted. The board's instruction to HR that the desk be sent the hiring plan each quarter was the only good thing to come out of the month. Nadia's first annual capacity plan, written that summer, had the next claims team on it two quarters before it arrived. The laptops were built in the slack. A growth plan the desk has not seen is a plan to surprise the desk, and the surprise always lands in the leave month.
The Annual Capacity Plan
The plan below is one page, written in the autumn for the following year and reviewed each quarter. Section A is the forecast from HR and the project office, with the date it was given. Section B is the desk's own bases, with the dates they were sampled. Section C is the grid, four quarters, each a range. Section D is the levers, one per gap, each with its lead time and the quarter in which it must be started. Section E is the review log, one line per quarter. Fill it in with the growth stage card from the first article in this series beside it. The card says which threshold the desk is approaching and the plan says in which quarter. Together they are the whole of this series on one side of a page.
ANNUAL CAPACITY PLAN — ONE PAGE, FOUR QUARTERS
Desk: ______________________   Plan year: from ________ to ________   Prepared by: ______________

A. THE ORGANISATION'S FORECAST (from HR and the project office; date given: ____________)
   Staff now: ______   Staff at year end: ______ to ______
   Starters by quarter:  Q1 ____  Q2 ____  Q3 ____  Q4 ____   Leavers by quarter:  ____ / ____ / ____ / ____
   Sites opening, closing or moving: ______________________________   quarter: ____
   Systems and projects going live: ______________________________   quarter: ____

B. THE DESK'S BASES (from its own tickets)
   Tickets per hundred staff per month: ______   (twelve-month base, taken on ________)
   Season: high months ____________  low months ____________   (years of data: ____)
   Median hands-on hours per ticket: ______   (sampled on ________, sample size ____)
   Hours per starter, including the first-fortnight tail: ______ to ______   (sampled on ________)
   Known-event hours (go-lives, moves): ______________________________

C. THE GRID (each figure a range; write the range)
   Quarter | Staff | Tickets/month | Hours needed | Hours available | Gap | Lever
   Q1      | _____ | ___ to ___    | ___ to ___   | _____           | ___ | ______________
   Q2      | _____ | ___ to ___    | ___ to ___   | _____           | ___ | ______________
   Q3      | _____ | ___ to ___    | ___ to ___   | _____           | ___ | ______________
   Q4      | _____ | ___ to ___    | ___ to ___   | _____           | ___ | ______________
   Hours available: nominal less leave (from the calendar), meetings, projects already given, admin.

D. THE LEVERS (one per gap; started in the quarter the lead time demands)
   Process: ______________________   lead time ____ weeks   start in Q__   costs the desk ____ hours
   Tool:    ______________________   lead time ____ months  start in Q__   licence ____  migration ____ hours
   Head:    ______________________   lead time ____ months  advert in Q__  starts Q__
   The gap each closes, and the gap left after it: ______________________________
   Agreed with: ______________   on: ____________   (a trigger is a request, not an entitlement)

E. QUARTERLY REVIEW LOG
   Q1: forecast ____ tickets/month, actual ____; gap forecast ____, actual ____; forecast re-asked [ ]; triggers moved: ______
   Q2: forecast ____, actual ____; gap ____ / ____; re-asked [ ]; moved: ______
   Q3: forecast ____, actual ____; gap ____ / ____; re-asked [ ]; moved: ______
   Q4: forecast ____, actual ____; gap ____ / ____; re-asked [ ]; moved: ______
   Lessons for next year's plan: ______________________________________________
Ben wrote Redbrook's first plan in the October after the graduates. HR's hiring forecast was on the top line because he had walked over and asked for it. The following September's intake, twenty-nine this time, was built across the summer two laptops a week. The fourth technician, advertised in the second quarter on the strength of a grid the finance director had seen in February, started in July. The head of engineering mentioned the intake over the car roof again, in August, out of habit. Ben said yes, all set, and for the first time it was true.
Frequently Asked Questions
HR will not share the hiring plan. What do I use instead?
How many hours should I budget per starter?
What if the plan shows a gap and the budget is refused?
Should the plan include the desk's own projects?
How far ahead should the plan look?
Can one plan cover several sites?
From the QuerySolv team: we build self-hosted help desk software for Windows. QuerySolv runs as one Windows service on your own network. It takes requests by web form, e-mail, live chat, social messages and REST API. It is licensed once per installation rather than per agent per month. The free trial runs the full product for 30 days.