
Measuring the Shift From the Hallway to Logged Work
The first Monday of the month, 09:30, at Ashgrove Housing. Yusuf runs a desk of four and has just sent the monthly report to the operations director. She has read it faster than Yusuf would have liked and has walked over, which is its own small irony given the subject. "Ticket volume is up by two thirds since the spring," she says. "Is that a problem?" The desk has spent six months logging every hallway request, opening a walk-up window, converting direct messages and redirecting, kindly, one person at a time. The work has not increased. The record of the work has. Yusuf has about thirty seconds to explain the difference, and he has a chart, which is more than most desk leads have in that moment.
Measuring the shift to logged work means tracking, month by month, how much of the desk's work arrives through routes that create tickets. It also tracks how much still arrives through the hallway, the direct message and the personal extension. It means being able to say honestly when the balance has changed. The earlier articles in this series counted the hallway, handled it, built the window and redirected people. This one is about proving it worked, in numbers a director can read, without being frightened by a volume figure that goes up. It is the last article in our The Walk-Up & Drive-By Culture series.
It starts with why logged volume rises when the culture improves, and why leadership must be told before it does. Then come the three numbers the measurement rests on, the chart from Ashgrove Housing as a worked example, and walk-up share over time. Next are the unlogged estimate and the quarterly census that produces it, the satisfaction difference between channels, the channel report, and declaring the culture changed. A short war story and the channel shift scorecard to copy finish the article.
Why Logged Volume Goes Up, and Who to Warn
The first effect of fixing a walk-up culture is that the desk's ticket count rises, sharply. Anyone reading the count without the context will conclude the desk is drowning. It is not. The work was always there; the first article in this series counted it with a census and found a desk reporting a minority of what it did. When the hallway requests become tickets, the window logs every visit and the direct messages are converted, the record catches up with the work. The catch-up looks on a chart like a surge. The desk did not get busier. It got visible.
Tell leadership this before the first month's number lands, not after. The sentence is: "Our logged volume is going to rise over the next quarter, because we are starting to log the hallway work that the census showed was about half of what we do; the total work is not changing, and I will show you both numbers side by side." A director who has heard that sentence reads the rise as the desk keeping its word. A director who has not reads it as a desk in trouble, and will act on that reading, sometimes expensively. That is the war story near the end of this article. The context costs one paragraph. The absence of context has cost desks a quarter.
The second effect is that every per-ticket figure moves, and some move the wrong way. Average handling time falls, because hallway tickets are short. First contact resolution may rise or fall depending on which walk-ups get logged. Tickets per technician jump. None of these changes means anything about the desk's performance; they mean the denominator changed. Say so on the report, in a footnote, every month for the first quarter, and compare like with like once the shift has settled.
The Three Numbers
The measurement rests on three numbers. The first is the logged total: every ticket opened in the month, from every source. It is counted the way Counting Tickets Properly describes, with duplicates merged and the desk's own internal tickets set aside. This is the number that rises. It is the record of the desk's size, and it is the figure that, once the shift is complete, finally matches the census.
The second is the walk-up share: the tickets whose source is the hallway (walk-up, drive-by, found-me-in-the-kitchen) divided by the logged total. For this to exist, every ticket needs a source recorded when it is logged. The sources need to be few and consistent: form, e-mail, phone, chat door, direct message, window, hallway. The share is the number that falls. It measures how much of the desk's work still arrives by the route the desk is trying to retire. It is reported as a fraction with its two counts, "20 of 395, about one in twenty". Never as a bare percentage with a decimal point on it. A decimal point on a count of twenty is a claim to precision the count cannot support.
The third is the unlogged estimate: how much work still happens outside the queue and never becomes a ticket. By definition the queue cannot count this. It is therefore estimated from a one-week census, repeated every quarter with the same sheet as the first one. The estimate is the honest number; it is the one that says how far the desk still is from the record being the work. It is reported as a range, carried as a dashed line between census weeks, and labelled as an estimate every time it appears. If you run QuerySolv, the standard reports on volume and satisfaction already cover every ticket in the one queue, hallway tickets included. In that case, most of the effort in this article is making sure the source is recorded when the ticket is logged. The unlogged estimate is the one figure no help desk tool can give you, because it is a count of what the tool never saw.
The Chart at Ashgrove Housing
Yusuf's chart, below, stacks the desk's logged tickets by source for the month before the shift and the six months after. The quarterly census estimate of unlogged hallway work is drawn as a dashed segment on top of each bar. The numbers are a worked example from one fictional desk of four, not a benchmark. The dashed segments between census months are carried from the nearest census rather than measured. The month labelled "before" is the census month from the first article in this series. It had 235 tickets logged, about 160 requests a week outside the queue scaled to the month's estimate, and no hallway tickets at all. None were being logged.
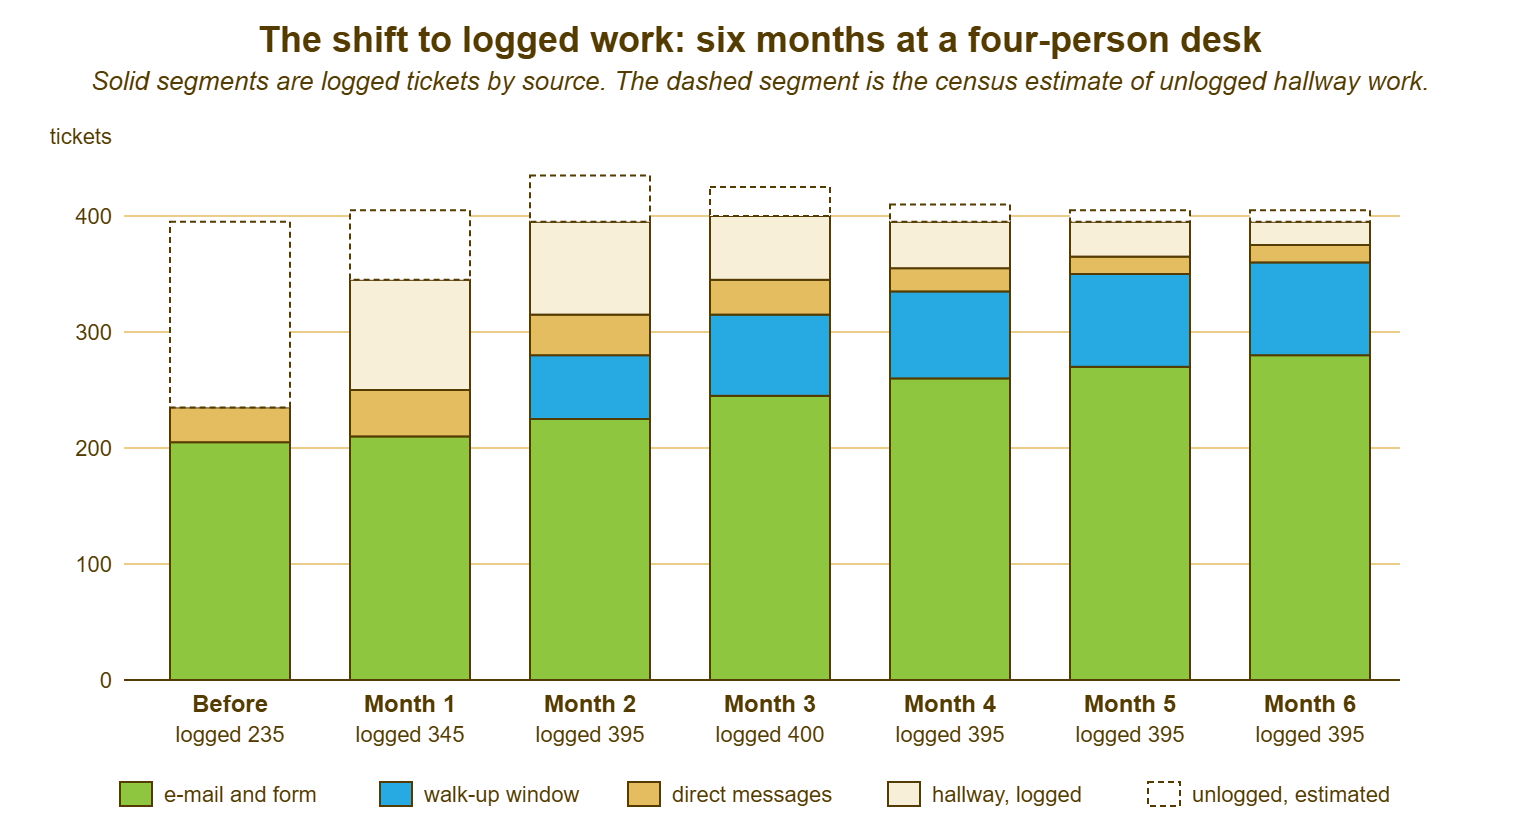
Read the chart from the top down. The dashed segment shrinks from about 160 to about 10, which is the unlogged work becoming logged. The cream hallway segment appears in month one at 95, because the desk started logging every corridor request on the spot. It then falls month by month to 20 as the window and the form take the traffic. The blue window segment appears in month two, when the window opened, and settles around 80. The amber direct-message segment falls from 40 to 15 as the status lines go up. And the green form-and-e-mail segment grows steadily from 205 to 280, which is the redirects working. The solid stack rises from 235 to about 395. The whole bar, solid and dashed together, stays between about 395 and 435 every month. That last sentence is the one Yusuf said to the operations director, with his finger on the chart, and it took less than the thirty seconds.
The chart is also a check on the honesty of the shift. If the solid stack had risen while the whole bar also rose, the desk would have been getting busier as well as more visible. That happens and is worth knowing. If the solid stack had stayed flat while the dashed segment shrank, people would have stopped asking rather than moved to the form. That is the failure mode the redirecting article warns about. The two outlines, solid and whole, tell those stories apart. Neither number does it alone.
Walk-Up Share Over Time
The walk-up share is reported monthly, as two counts and a fraction, and the shape to expect is a fall to a floor rather than a fall to zero. At Ashgrove the share went from about one in four in month one to one in five, one in seven, one in ten, one in twelve and one in twenty by month six. It will not reach zero, and a desk should not want it to. A building with corridors will always produce some hallway requests, and the twenty-second reply exists so that they are logged rather than refused. The floor is the share at which the hallway is a minor route rather than the main one. For most desks it is somewhere around one in twenty to one in ten. It is found by watching where the fall flattens rather than by picking a target.
Month-on-month movement in the share is noisy at small volumes, and the honest reading is a trend over a quarter. A desk logging forty tickets a month will see its share jump by a tenth when four walk-ups happen in one bad week. A trend line drawn through that is a trend line drawn through weather. Report the monthly counts and read the quarterly direction. Treat the seasonal shape of the desk's volume, which Trends and Seasonality explains, as part of the picture. The hallway is busiest in the weeks when the building is fullest. A September rise in the share at a college is the term starting, not the culture slipping.
Cut the share by department as well as for the whole desk. The departments that walk up are not the departments that file, and the shift happens at different speeds in each. The first article's census found that the two departments nearest the desk produced more than half of the walk-ups; six months on, the question is whether those two have moved. A share that has fallen desk-wide while one department's hallway count is unchanged means the redirects have not reached that department. Usually its manager has not been spoken to, and the fix is a conversation rather than a chart.
The Unlogged Estimate and the Quarterly Census
The unlogged estimate comes from running the first article's one-week census again, every quarter, with the same sheet and the same instruction. Tally every request that did not arrive by a ticket-creating route, change nothing else, and note whether it was logged. The difference from the first census is that most rows now say "logged", because the twenty-second reply has become a habit. The estimate is the count of rows that do not. At Ashgrove the first census found about 160 unlogged requests in the week; the quarter-one census found 25; the quarter-two census found 10. The dashed segments on the chart are those three numbers, carried across the months between.
Present the estimate as a range and say where it came from, every time. "Unlogged work: about ten to fifteen requests a week, from a one-week census in the last week of the quarter, down from about a hundred and sixty before the shift." The range admits that one week is one week; the source tells the reader it was counted rather than guessed; the comparison is the point. An estimate presented as a single number with no method is an opinion in a column, and the first director who asks how it was produced will be right to.
Back the census with a spot-check that costs nothing: ask three people in the quietest department how they got help last time, and listen for a name. If the answer is the form, the window or the number on the sign, the estimate is probably honest. If the answer is "I usually find Dev", the census has missed a route. Often it is a personal extension or a technician who still fixes things at the pillar. The estimate is low. The spot-check is also the kindest early warning the desk has that a shadow channel is re-forming, which they do, quietly, whenever the queue has a slow month.
Remember: report the logged total, the walk-up share as two counts and a fraction, and the unlogged estimate as a range with its census week named. Show them side by side, every month. The logged total rising is the shift working; only the whole bar, logged plus estimate, says whether the desk got busier.
The Satisfaction Difference
Satisfaction by source is the number that tells the desk whether the shift cost it anything with the people it serves. It is read by channel, never by technician, with a minimum sample before any figure is read at all. Where the satisfaction request goes out with the resolving reply, every logged ticket can be rated whichever door it came through. The monthly cut by source shows three things worth knowing. The window scores high, because a person who sat in a chair and watched their request being written down and fixed has had a good experience. The form's score rises over the quarter, because the desk is answering it within the hour now that the corner is quiet. And the hallway-logged tickets score high too, which is a trap. Many of them were fixed on the spot and rated by a person who had just been helped in two minutes. A high score on the hallway is not an argument for keeping the hallway, and the report should say so before anyone makes it.
The minimum sample rule applies with force here, because the channels are small. A window logging eighty tickets a month with thirty ratings is readable as a trend over a quarter. A direct-message channel with fifteen tickets and four ratings is not readable at all. A figure derived from four ratings should not appear on a report with a decimal point or without a count beside it. The rules for cutting satisfaction by category, and the stricter ones for cutting it by person, are in Satisfaction by Category, and Carefully by Agent. The channel cut is a category cut and follows the same floor.
The useful comparison is the form's score before and after the shift, because the form is the route the desk is asking people to use. Its score is the measure of whether that request was fair. At Ashgrove it went from about seven in ten positive in the census month to about eight and a half in ten by month six, on a sample that grew with the volume. That is the number to put beside the walk-up share on the report: not "people walked up less" alone, but "people walked up less and the route we sent them to got better". Without the second half the first half is a desk congratulating itself on being avoided.
The Channel Report
The channel report is one page a month with the three numbers, the satisfaction cut, the window's visits by hour, and one sentence of interpretation. It goes to leadership as a section of the monthly report rather than as a document of its own. The layout of the monthly report that leadership will actually read, and the discipline of one page and one question per number, is in The Monthly Report They Will Read. The channel section follows that discipline and takes about a third of the page. The table below is the section's shape, filled in with Ashgrove's month six.
| Line | This month | Last month | Census month | Reads as |
|---|---|---|---|---|
| Logged total | 395 | 395 | 235 | Record now matches the work; flat for three months |
| By source: form and e-mail / window / direct message / hallway | 280 / 80 / 15 / 20 | 270 / 80 / 15 / 30 | 205 / none / 30 / none logged | Hallway down, form up, window steady |
| Walk-up share | 20 of 395, about one in twenty | 30 of 395, about one in twelve | not measurable; none logged | At the floor; hallway is now a minor route |
| Unlogged estimate (quarterly census) | about 10 a week | carried from census | about 160 a week | Nearly all work is now in the record |
| Satisfaction by source (positive, with count) | form 8.5 in 10 (110) / window 9 in 10 (31) / hallway not read (6) | form 8 in 10 (98) / window 9 in 10 (29) | form 7 in 10 (60) | The route people were sent to got better |
| Window visits by hour | peaks at the opening of each block | same | no window | Hours still fit; review at the quarter |
| Interpretation | Logged volume rose because the desk became visible, not busier; the whole bar is flat. Culture declared changed this month; see criteria. | |||
The desk may already keep a channel plan, the one-page document that says which routes it offers, at what hours, with what promise. In that case, the monthly channel section is the measurement that plan was waiting for. The plan's shape is in the channel strategy template. The two documents should agree about which sources exist and what each is for. A channel on the report that is not on the plan is a shadow channel the desk has started counting, which is progress. A channel on the plan that never appears on the report is a door nobody is using, which is a different conversation.
Declaring the Culture Changed
The culture is declared changed when five things have been true for three consecutive months. The declaration is one sentence on the report, not a party. The five: the walk-up share has sat at or below the floor the desk chose. The unlogged estimate from the latest census is a small fraction of the logged total, which for most desks means under one in twenty. No department with more than a few dozen staff has gone a month without raising a ticket. The direct-message count is low and steady rather than falling, which means it has stopped going underground. And the window has logged every visit, which the window laptop proves. Three months, because one month is weather and two is a coincidence.
Write the criteria down before the shift starts, in the scorecard at the end of this article, so that the declaration is a check against a list and not a feeling. A desk that decides after the fact what "changed" meant will decide it means whatever the current numbers show. The operations director will, reasonably, ask why the goalposts have wheels. The criteria do not have to be ambitious. They have to be written in advance and read the same way every month, which is the same rule every honest measurement in this library follows.
After the declaration, the measurement continues at a lower cadence, and the habits continue at full strength. The share and the sources stay on the monthly report in one line. The census drops to twice a year. The window standard gets its hours reviewed at each quarter. The twenty-second reply is taught to every new technician in their first week, because the hallway culture is not defeated, it is managed. A desk that stops managing it will have its corner back within a season. The sixth article in this series ends here, and the first article's census is where the next desk lead starts. (The folder at Meridian Parts is still labelled "the other two hundred". It is now mostly empty, which is the point.)
A Short War Story: The Volume Scare at Marlow Dairy
Marlow Dairy, a co-operative with a three-person desk, fixed its walk-up culture over a spring, with a window, a logged hallway and converted messages. The desk lead, Petra, sent the first monthly report of the new regime without a word of context. The numbers seemed to her to speak for themselves. The report showed logged volume up by more than half in two months. The finance director had never seen the census and had no idea the hallway had existed. He read it as a desk being overwhelmed and raised it at the board. He had a consultant engaged for a quarter to review "the support demand problem". The desk later worked out that the cost was roughly a year of the window's loan kit. The consultant's first question to Petra was whether anything had changed in how tickets were recorded. Her answer took eleven minutes and ended the review, but not the engagement, which had been signed for the quarter. Petra's next report carried the census figure, the unlogged estimate, and the sentence "the whole bar is flat" beside a chart that showed it. The finance director, to his credit, kept that chart on his wall. The cost was a quarter of a consultant's fees and three months during which the desk's good work was read as its failure. A rising count without its baseline is not a result; it is an alarm, and somebody will answer it.
The Channel Shift Scorecard
The scorecard below is filled in once at the start, with the census baseline and the five criteria. Then fill in one column a month until the culture is declared changed and for a quarter after. Section A is the baseline from the first census and is never edited. B is the monthly line; C is the quarterly census. D is the satisfaction cut with its counts; E is the five criteria with a tick per month. F is the declaration. Keep it with the monthly report. When the operations director walks over on the first Monday of the month, as they will, hand them this and the chart and say the sentence in section F.
THE CHANNEL SHIFT SCORECARD — ONE PAGE, ONE COLUMN A MONTH
Desk: ______________________   Technicians: ____   Shift started: ____________

A. BASELINE (from the first census; never edited)
   Logged tickets in census month ................. ______
   Requests outside the queue in census week ...... ______   of which logged ______
   Unlogged estimate, per week .................... ______   per month (x4.3) ______
   Walk-up share ................................... not measurable (hallway not logged)
   Form satisfaction, positive in ten, count ...... ______ (____)
   Floor chosen for walk-up share .................. 1 in ______

B. MONTHLY LINE                         M1     M2     M3     M4     M5     M6
   Logged total .....................  _____  _____  _____  _____  _____  _____
   Form and e-mail ..................  _____  _____  _____  _____  _____  _____
   Window ...........................  _____  _____  _____  _____  _____  _____
   Direct message ...................  _____  _____  _____  _____  _____  _____
   Hallway (walk-up, drive-by) ......  _____  _____  _____  _____  _____  _____
   Walk-up share (count / total) ....  _____  _____  _____  _____  _____  _____
   Departments with zero tickets ....  _____  _____  _____  _____  _____  _____

C. QUARTERLY CENSUS (same sheet as the first; one ordinary week)
   Quarter 1: outside requests ______   unlogged ______   estimate/week ______ to ______
   Quarter 2: outside requests ______   unlogged ______   estimate/week ______ to ______

D. SATISFACTION BY SOURCE (positive in ten, with count; not read under ____ ratings)
   Form ......... M1 ____ (__)  M3 ____ (__)  M6 ____ (__)
   Window ....... M1 ____ (__)  M3 ____ (__)  M6 ____ (__)
   Hallway ...... read only when count allows; never used to argue for the hallway

E. THE FIVE CRITERIA (tick per month; three consecutive ticks on all five = changed)
                                              M1   M2   M3   M4   M5   M6
   Walk-up share at or below the floor ....... [ ]  [ ]  [ ]  [ ]  [ ]  [ ]
   Unlogged estimate under 1 in 20 of logged .. [ ]  [ ]  [ ]  [ ]  [ ]  [ ]
   No sizeable department at zero tickets ..... [ ]  [ ]  [ ]  [ ]  [ ]  [ ]
   Direct messages low and steady ............. [ ]  [ ]  [ ]  [ ]  [ ]  [ ]
   Window logged every visit .................. [ ]  [ ]  [ ]  [ ]  [ ]  [ ]

F. THE DECLARATION (one sentence on the monthly report)
   "Logged volume rose from ______ to ______ because the desk became visible, not busier;
    the whole bar, logged plus the unlogged estimate, has stayed between ______ and ______.
    All five criteria have held for three months; the walk-up culture is changed as of ______."
   After: share and sources stay on the report monthly; census twice a year; window hours
   reviewed quarterly; the twenty-second reply taught in every new technician's first week.
Yusuf's thirty seconds with the operations director ended with the chart on her screen and the sentence from section F read aloud. Her reply, which he wrote down, was "so the number I should have been worried about was the old one". He agreed that it was. The desk at Ashgrove Housing now reports about four hundred tickets a month, which is what it always did. The walk-up share sits at one in twenty, where it will stay for exactly as long as the desk keeps logging the corridor. The culture is changed. It is not finished, because it never is, but it is counted, and a thing that is counted can be kept.
Frequently Asked Questions
Our tool has no source field. How do we record where a ticket came from?
Is it dishonest to show the unlogged estimate on a chart when it is only measured quarterly?
Logged volume rose but the whole bar rose too. What does that mean?
How small can a desk be and still measure this?
The walk-up share fell to zero in one month. Should we celebrate?
What goes on the report once the culture is declared changed?
From the QuerySolv team: we build self-hosted help desk software for Windows. QuerySolv runs as one Windows service on your own network. It takes requests by web form, e-mail, live chat, social messages and REST API. It is licensed once per installation rather than per agent per month. The free trial runs the full product for 30 days.