
First Contact Resolution by Category: Where It Can and Cannot Rise
The monthly operations meeting at Harbourview Clinic, 09:30, and the IT slide is up. Noor, who runs the desk of four, has reported first contact resolution for the second month, honestly counted, at a little under half. Hal, the clinic director, reads the figure and asks the question she had been waiting for: "So half the time someone asks, we don't fix it. Could we get that to four in five?" It is a fair question, asked kindly, and Noor does not have the answer in the room. She has it that evening, when she cuts the month's 410 tickets by category. She finds that 118 of them were hardware repairs, purchases and access requests that needed a manager's approval. None of those could have been fixed on first contact by anyone. Together they had quietly put a ceiling on the desk-wide figure that no amount of effort on the first line would lift.
First contact resolution by category is the same count, cut by the kind of work. For each category of ticket, it is the share that the first person fixed in the first exchange and that stayed fixed. The desk-wide figure is a blend of these, weighted by how many tickets each category brought. It moves when the blend moves as readily as when the desk improves. That is why one number for the desk can go up in a month when nothing got better and down in a month when everything did. This article is part of our First Contact Resolution series; the counting rules it relies on are in Measuring First Contact Resolution Honestly. And the honest ways of raising the number are in Raising First Contact Resolution Without Cherry-Picking. This one is about reading the figure by the shape of the work.
It covers why one number hides the shape, then the categories that cannot rise and why, then the ones that should be high. Next come the middle band where the work pays and setting an expectation per category from your own tickets. We cover the mix-adjusted reading, category hygiene, and what to look at each month. We finish with a short war story and the per-category expectation table to copy, in that order.
One Number for the Desk Hides the Shape
A desk-wide first contact resolution figure is an average. And an average of very different things tells you about the mix before it tells you about the desk. Suppose Harbourview fixes nine in ten password tickets on the spot and one in ten hardware repairs, which is roughly what Noor found. A month with many password tickets and few repairs gives a flattering figure. A month after a batch of ageing laptops starts failing gives a poor one. In both months the first line did exactly the same job to exactly the same standard. The number moved. The desk did not.
This is the mix problem, and it is the reason a reader who sees only the desk-wide figure will ask the wrong question. Hal's "could we get to four in five?" assumed the figure measured effort or skill. It measured, in that month, that about three tickets in ten were of kinds that cannot be fixed in one contact by anyone. It also measured that the other seven in ten were being fixed first time about two thirds of the time. Those are two different facts and they want two different conversations. One is about whether the structural categories could be made faster or smaller. The other is about whether the first line could finish more of the rest.
The cure is not to drop the desk-wide figure, which still belongs on the monthly page as the honest total. It is to read that figure beside a table of categories, each with its own expectation. The table is where the questions get answered. The total is where they get asked. (The total will keep getting asked. That is what totals are for.)
The Categories That Cannot Rise
Some kinds of work have a second contact built into them. And no first line, however skilled or well-permissioned, will fix them in one exchange. A hardware repair needs a part, or a technician at the desk, or both. The first contact is a diagnosis and the fix is a visit. A purchase needs a quotation, an approval and a delivery. And the requester will hear from the desk at least twice before the laptop arrives. An access request for anything beyond the standard groups needs a manager's yes, and the yes arrives on the manager's schedule, not the desk's. Anything waiting on a vendor waits on the vendor. These are not failures of the first line; they are the shape of the work.
The honest response is to set the expectation for these categories low and say so plainly. Measure them on something they can control: how fast and how predictable the second contact is. A hardware ticket where the first contact ends with "a technician will be at your desk between two and three this afternoon, and here is a loan laptop in the meantime" is a good ticket that will never count as first contact resolution. And the desk should not want it to. The number that matters for it is resolution time by category, which is the subject of By Category and Priority in the time-to-resolution series. The handling of the vendor wait belongs to escalating to vendors and other teams.
There is one honest way to lift a structurally low category, and it is to remove the structure, not to count around it. If the standard laptop request needs a manager's approval every time, agree once with the managers that any request matching the standard build is pre-approved. With that agreement, the request becomes something the first line can fulfil on the spot. The mechanics of that are in Requests, Approvals and Fulfilment. If every hardware fault needs a visit, a small stock of swap devices at the desk turns some visits into a hand-over. The category's expectation rises because the work changed. That is a real rise, and it is the only kind worth having in the low band.
The Categories That Should Be High
At the other end are the categories where the first person can finish nearly every ticket, and a low figure there is a finding rather than a fact of life. Password resets and account unlocks, when the first line holds the right. Questions that begin "how do I", when the answer exists and the technician can find it. Standard access to groups and shared mailboxes from an agreed list. Printing: the stuck queue, the missing driver, the printer that needs mapping. Known errors with a documented workaround, where the first contact is "yes, we know, here is what to do until it is fixed". These categories share one property: nothing outside the desk has to happen before the requester is working again.
When a category in this band comes in low, the cause is one of the four from the previous article, and it is almost always knowledge or permission. A desk that fixes only half its password tickets on first contact has one of these problems. Its first line cannot reset passwords, or cannot verify identity quickly enough to do it on the call. Or it is handing them to someone who can. A desk that fixes only half its "how do I" tickets has a knowledge base nobody searches, or no knowledge base. Neither is a reason to lower the expectation. Both are a reason to read the handoffs and fix what they say.
Noor's high band at Harbourview came out, over three ordinary months, at roughly nine in ten for unlocks. It was a little over four in five for "how do I". Standard access was about three in four and printing was somewhere between three in five and four in five. Those are the ranges in the picture further down. They are Harbourview's and nobody else's. A clinic with a stricter identity check on resets will sit lower on the first row and should. A desk whose printers are managed by a contractor may not have a printing row at all.
The Middle Band, Where the Work Pays
Between the two sit the categories whose figure depends on what the first line knows and may do. This is where the improvement work from the previous article pays most. Application errors: some are a known fix, some need the application owner, and the share the first line finishes rises with every runbook. Network and connectivity faults: a profile re-enrolled on the call, or a visit to look at a cable. Mobile devices: the same. These categories have a real ceiling, because some tickets in them genuinely need the second line or a visit. But the ceiling is well above where many desks sit, and the gap is made of knowledge and rights.
The middle band is where the per-category reading does its most useful work month to month. A rise here is the runbooks landing. A fall is often a new application, a new device model or a leaver taking knowledge with them. At Harbourview, application errors sat between two in five and three in five across the quarter. The month a new scheduling application arrived they dropped to one in four. Noor could see and name that on the same page where the desk-wide figure had fallen by a few points. Without the table, the reasons would have looked like the whole desk slipping. It was one category, one application, and one runbook that did not exist yet.
Setting an Expectation per Category
An expectation is where a category's figure sits when the desk is working normally, written as a range from your own tickets. It is not a target. A target is a number someone wants; an expectation is a number you have observed and will notice a departure from. The difference matters because a target on a category invites the same cheats as a target on the desk. An expectation only invites the question "why is this month outside the range?", which is the question you want.
Set it from three ordinary months, the same way a baseline is set for any other desk figure. Count each category's first contact resolution under the counting rules sheet for each of the three months. Write down the lowest and highest. And that spread is the expectation. "Ordinary" means no rollout, no outage, no reorganisation in that category during those months. If one of the three was unusual, say so and widen the range or take a fourth month. Then assign each category to a band, structurally low, middle, or should-be-high, by asking one question. Does anything outside the desk have to happen before the requester is working again? If yes for most tickets, the category is low band whatever its figure says. If no, it belongs higher, and a low figure is a finding.
The picture below is Harbourview's table drawn as bands, with each category's expectation as a bar from its lowest to its highest month, coloured by band. The green rows should sit near the top and mostly do. The amber rows are where the runbooks and rights will move the figure. The orange rows are low because the work has a second contact in it, and their bars will not climb unless the work changes. The scale runs from none to all, and the ranges are one fictional desk's, offered to show the shape and not to be copied.
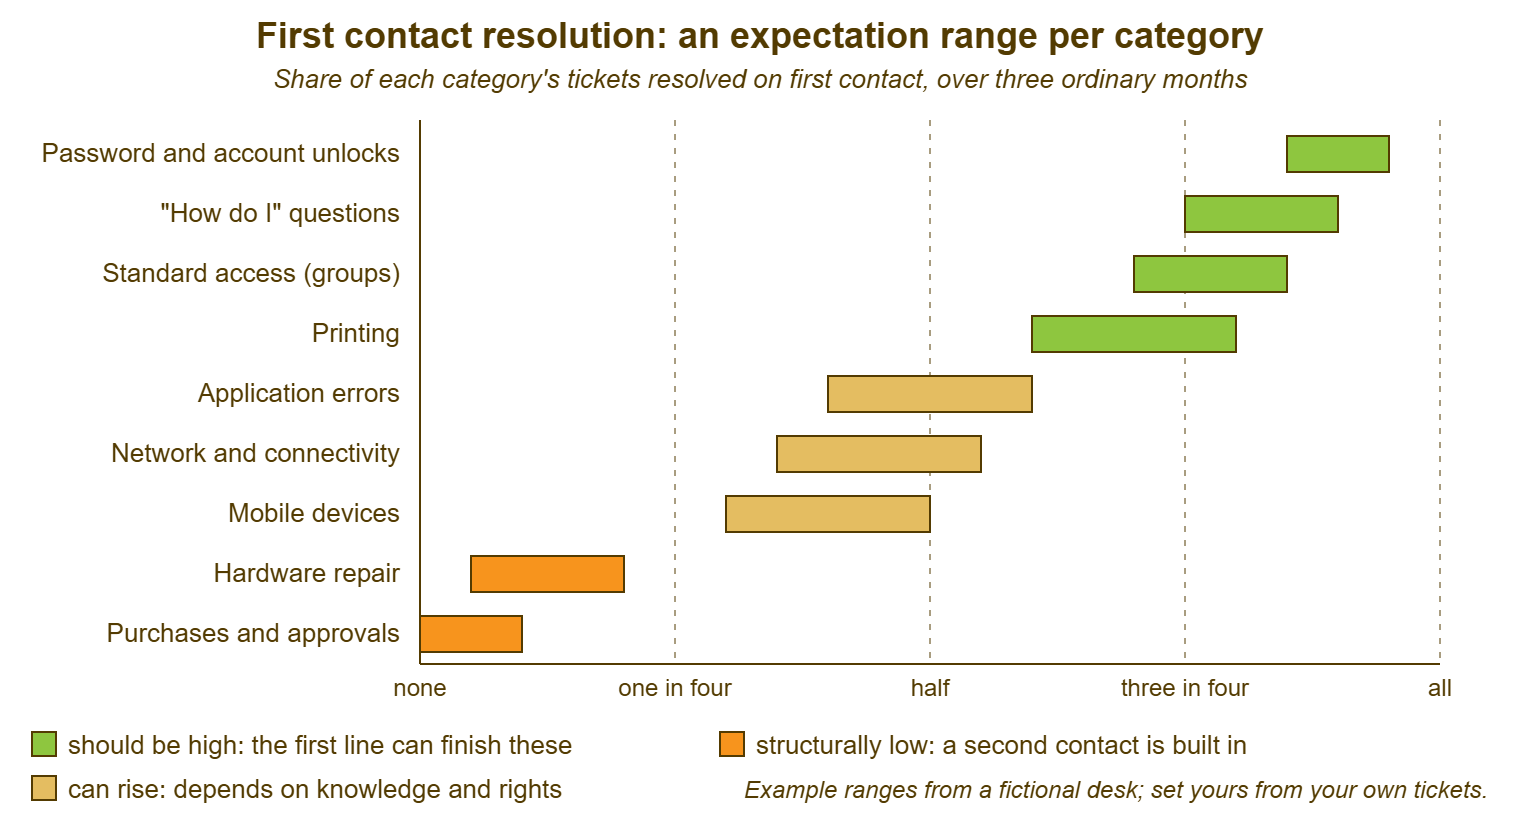
Read it as a map of where effort pays. The green rows that fall short of their band are permission and knowledge problems with a ticket list attached. The amber rows are the quarter's improvement plan. The orange rows are a conversation with the people who own the approvals and the hardware budget, not with the first line. A manager who has seen this picture once stops asking whether the desk can reach four in five, and starts asking which row it should move. That is a better meeting, and it takes one chart.
The Mix-Adjusted Reading
Once the table exists, one more line answers the question "did the desk improve, or did the mix shift?" It is worth the two minutes of arithmetic. Take last quarter's share of tickets in each category, which is the mix you are holding constant. Multiply this month's first contact resolution for each category by that share, and add the results. In plain words: what would this month's desk-wide figure have been if the tickets had arrived in last quarter's proportions? If that number is higher than last quarter's figure, the desk improved. If the raw figure rose but the mix-adjusted one did not, the month had fewer hard tickets and the desk did the same job.
Noor used this the month the desk-wide figure rose by several points and Hal congratulated the team. Held at the previous quarter's mix, the figure had barely moved. The month had been light on hardware faults because a batch of replacement laptops had landed. The password and access categories had done what they always did. She told him, which he did not expect and which he remembered. A desk that corrects its own good news is believed about its bad news, and that credit is worth more than the points were.
Category Hygiene First
A per-category reading is only as good as the categories, and many desks' categories were never designed to be read. If a third of the month's tickets sit in "Other", the table has a row that means nothing and the real categories are undercounted. If "Printing" and "Printers" both exist, the printing row is split in two. If the category is set at open and never corrected, the ticket that arrived as "network" and turned out to be a password problem is in the wrong row. Categorize at Close, Not Just at Open is the habit that fixes it. Tidy the categories before setting expectations, or the expectations will be for piles that do not exist.
Small categories need merging for this purpose, not reading. A category with eight tickets in a month will show a first contact resolution of anything from nothing to everything on the strength of two tickets. And a range drawn from it is noise. Noor's rule at Harbourview is that a category needs twenty-five tickets in the quarter before it gets a row of its own. Below that it is grouped with its nearest neighbour for this reading, and the grouping is written on the sheet. The categories that make a monthly report worth reading, and the pruning that keeps them that way, belong to Categories That Make Reports Worth Reading. This article only insists that the pruning happens first. Categories breed, and they are worse at arithmetic than they look.
What to Look at Each Month
The monthly reading of the table takes ten minutes and asks three things of each row. Is a green row below its range? Then read its handoffs and find the cause, because a should-be-high category falling short is the clearest signal the number gives. Did an amber row move? If up, name what landed; if down, name what arrived, because the middle band moves for reasons that are usually one application or one device model. Did an orange row change at all? It mostly will not. When it does, it is because the work changed: a pre-approval agreed, a swap stock established, a vendor contract renegotiated. That is worth a line in the report because it was hard-won. Where the tool reports reopen and escalation rates as standard, as QuerySolv does, the two figures that keep this table honest are a glance away.
Then read the desk-wide figure last, with the mix-adjusted line beside it, and write the one sentence that explains the month: "desk-wide figure down three points, entirely in application errors after the scheduling rollout; runbook in progress; all other rows within range". That sentence is what goes to Hal. And it is the sentence the next article in this series, on the limits of the number, and the one after, on the monthly review, both assume you can write. The table makes it possible. Without it, the sentence is "the figure went down", and a meeting follows.
Remember: set an expectation per category from three ordinary months of your own tickets, as a range and never as a target. Band each category by whether anything outside the desk must happen before the requester is working again. Read the desk-wide figure beside the table, and ask of every move whether the desk changed or the mix did.
A Short War Story: The Split Ticket at Meridian Parts
At Meridian Parts, the operations director set a desk-wide first contact resolution target of three in four. The desk lead, Owen, passed it down to each category equally, including purchasing. Purchasing had been running at about one in twenty because every order needed a quotation, an approval and a delivery. The two technicians who handled purchases found the only way to meet it. They marked each purchase ticket resolved when the order was placed and opened a second ticket for the delivery. That way, the first ticket had one contact and the second had one contact and both counted. Purchasing's figure reached three in four inside a month. The ticket count for the category roughly doubled. The requesters, who now received two ticket numbers for one laptop and a survey for each, began replying to the surveys with the word "why". Owen found it when the volume report showed purchasing had become the desk's largest category. He spent a fortnight merging tickets and a longer time explaining to the director why the category's figure had fallen back to one in twenty and should stay there. A category that cannot rise will be made to look as if it did, and the cost is always paid by the requester and the record.
The Per-Category Expectation Table
The table below is the template Noor filled in for Harbourview, with the rows left as the common categories and the figures blank, because the ranges have to be yours. For each category, write the band, the reason a second contact happens if it does, and the three-month range. Write the one change that would move the row if any, and who owns that change. The bands and reasons are durable and can be copied; the ranges are not and must be counted. Review the table each quarter, and recount the ranges once a year or after any change to the work. Keep the old versions, because the history of a row is the history of what the desk fixed.
| Category | Band | Why a second contact happens | Expectation (three-month range) | One change that would move it | Owner |
|---|---|---|---|---|---|
| Password and account unlocks | Should be high | Only if the first line lacks the right or the identity check is slow | ____ to ____ | Reset right for the first line; identity check written into the runbook | ________ |
| "How do I" questions | Should be high | Only if the answer is not written down or not found | ____ to ____ | Runbooks and public articles for the twenty commonest questions | ________ |
| Standard access (groups, mailboxes) | Should be high | Only if the group is off the agreed list | ____ to ____ | Agreed list of standard groups; membership right for the first line | ________ |
| Printing | Should be high | Hardware faults in the printer itself | ____ to ____ | Queue and driver rights; a runbook per printer model | ________ |
| Application errors | Can rise | Some faults need the application owner or a vendor | ____ to ____ | A runbook per application from the second line's resolution notes | ________ |
| Network and connectivity | Can rise | Cabling, switch ports and anything needing a visit | ____ to ____ | Re-enrolment rights and a connectivity runbook for the first line | ________ |
| Mobile devices | Can rise | Physical damage; carrier faults | ____ to ____ | Enrolment rights; a loan-device stock at the desk | ________ |
| Hardware repair | Structurally low | A part, a visit, or both | ____ to ____ | Swap stock at the desk turns some visits into hand-overs | ________ |
| Purchases and approvals | Structurally low | Quotation, approval and delivery | ____ to ____ | Pre-approval for the standard build; nothing else will move it honestly | ________ |
| Other (should be small) | Not read | Mixed; recategorise at close | not set | Prune until this row is under a tenth of the month | ________ |
Noor took the filled table to the next operations meeting, with the desk-wide figure printed above it and the mix-adjusted line beneath. Hal looked at it for a while and asked which row she wanted to move first, which was the question she had wanted a month earlier. She said application errors, and the scheduling runbook, and he asked what it would take. It took a fortnight. The desk-wide figure moved a little, and the application row moved a lot. And the question of four in five has not come up since, because everyone in the room can now see the orange rows and knows what they are.
Frequently Asked Questions
Should we just exclude the structurally low categories from the desk-wide figure?
How many categories should the table have?
Our categories are a mess. Can we still do this?
Can an expectation become a target later?
How often should the ranges be recounted?
Does the mix-adjusted figure replace the desk-wide one in the report?
From the QuerySolv team: we build self-hosted help desk software for Windows. QuerySolv runs as one Windows service on your own network. It takes requests by web form, e-mail, live chat, social messages and REST API. It is licensed once per installation rather than per agent per month. The free trial runs the full product for 30 days.