
Measuring the Shift to Proactive Support Honestly
Thursday, 16:45, at Redbrook Engineering, at the end of the fourth quarter. Imogen has the quarterly review on Monday and the volume chart open. The desk took about 520 tickets a month a year ago and takes about 410 now. The operations director, who approved the prevention hour in the spring with visible reluctance, will look at that chart. He will ask the only question he ever asks: "how much of that was you?" The flattering answer is "all of it". The honest answer is "most of it, and here is how we know which part". And the honest answer is the one that gets the hour renewed, because the director has been shown flattering charts before and has learned to divide them by two.
Measuring the shift to proactive support is four numbers read together. They are the share of the desk's hours spent on prevention and the categories removed. Then come the tickets that never arrived with the counterfactual stated, and the before-and-after count by ticket type. Add one line in the leadership report that carries all four without an adjective. Each number on its own can be made to lie without anyone intending it to; together they keep each other honest. This article is part of our From Reactive to Proactive Support series. This is the last article, because it is the one that tells you whether the other five worked.
It covers the four numbers and the lie each one prevents. Then we cover the share of hours in prevention and what "removed" has to mean before a category is counted as removed. We cover the tickets that never arrived, counted with the counterfactual said out loud, then before-and-after by type, as a table. Next comes the picture of where Redbrook's hours went across four quarters, then from tickets to hours, in two columns. We cover the line in the leadership report and what the numbers must never be used for. A short war story and the proactive scorecard to copy follow, in that order.
Four Numbers, and the Lie Each One Prevents
A single number for the programme will be wrong in whichever direction is convenient. And the four are chosen because each catches a different way of being wrong. Total volume falling is the number everyone reaches for. It falls for a dozen reasons that have nothing to do with prevention. Those include a quiet season, a department that left, a shadow channel that opened, a category that was relabelled. Hours spent on prevention is the number the desk reaches for when volume has not moved yet. It measures effort, not result; a desk can spend a hundred hours removing nothing. Categories removed is a count of names, and a name can be ticked off because its tickets moved next door. Before-and-after by type is the honest one, and on its own it is a table nobody reads. Read together, each covers the others' blind spot.
| The number | The question it answers | The lie it prevents | What it cannot tell you alone |
|---|---|---|---|
| Share of hours in prevention | Does the programme exist, in the calendar, this quarter? | "We are proactive now" with no hours behind it | Whether any of the hours removed anything |
| Categories removed | Which causes are gone, by name, with before and after? | A volume drop with no cause anyone can point at | Whether the tickets moved to another label |
| Tickets that never arrived, with the counterfactual | How many fewer tickets a month, in the types we fixed, against a baseline, with a control? | Claiming the whole queue's drop | How much desk time that is worth |
| Before and after by type | What did each fixed type do, month by month, beside a type we did not touch? | Season, drift and relabelling passed off as prevention | The overall shape; it is a table, not a story |
Every number in this article is a worked example from Redbrook, the fictional desk of four that the first article in this series audited, and is given as such. A different desk will see different figures; the shape, four numbers that agree with each other and a range rather than a point, is the part that travels.
The Share of Hours in Prevention
The share of hours is the desk's working hours a week spent on removing causes, over its total working hours. And it is counted from the roster and the prevention-hour ledger rather than from timesheets. Redbrook has four technicians and about 140 working hours a week between them. In the audit quarter the prevention line was zero, honestly recorded. In the second quarter it was four hours a week, one each. In the third, it was six, when the lead's hour was added and one technician's grew. In the fourth, it was eight, when the agreement was renewed at two hours each. Those are small fractions of 140. And the number's job is to prove the programme is in the calendar, not to impress anyone with its size.
Count the hours actually taken, not the hours scheduled. The gap between the two is the protection failure the prevention hour article warned about. It is worth seeing. The ledger says how many hours were taken, how many were moved and taken late, and how many were lost with their reasons. Redbrook's fourth quarter scheduled 104 hours and took 93. The eleven lost were listed. Seven of them were one bad week in which a major incident was declared, which is a permitted reason. A quarter that schedules a hundred hours and takes forty has not got a measurement problem. It has got a protection problem, and the share-of-hours number is where it shows first.
The share of hours is reported beside the hours returned, never alone, because effort without result is the thing leadership is most afraid of funding. Eight hours a week spent is a cost. Eight hours a week spent, returning forty-five to eighty a month, is an investment. A desk that reports only the hours it spent is asking to be told to stop spending them.
Categories Removed, and What "Removed" Has to Mean
A category is removed when all of these conditions hold. Its monthly count has fallen to a small fraction of its baseline for two consecutive readings. There is a control type that did not fall, and the tickets have not reappeared under another label. That is the whole rule, and every word of it is there because of a way the count has been fooled. "A small fraction" rather than zero, because a cause removed from forty machines will still produce a ticket from the forty-first. Redbrook's stale-credential lockouts went from about fifty-four a month to about nine, and nine is removed, not failed. "Two consecutive readings", because one quiet month is weather. "A control type", because if printer tickets also fell by half in the same months, the desk got quieter and the fix gets credit only for the rest. "Not reappeared under another label", because a fix that changes the symptom moves the tickets from "lockout" to "cannot sign in". In that case, a category report will show the first falling and never connect it to the second rising.
List the removed categories by name with the before and after beside each, and use the three words from the loop: removed, reduced, returned. Redbrook's year had four removed. The stale-credential lockouts fell from fifty-four to nine. Tickets for the printer driver that reset its defaults after every update fell from thirty-one to six. The disk-full slowdowns on the works-site machines fell from sixteen to two. The dock disconnects on one laptop model fell from twenty-four to six. Redbrook's year had one reduced, the shared-mailbox request for new sales starters, fourteen to eight, because the role profile caught most but not all. And Redbrook had one that returned in the third quarter, a scheduled restart that stopped running after an update. That return was caught at the loop and fixed again. It is on the list with "returned, re-fixed" beside it, because a list with no returns on it is a list nobody checked.
Four removed, one reduced, one returned is an honest year for a desk of four, and the honesty is what makes the four believable. Say which categories were not touched, too: new-starter lockouts, genuine printer faults and the drawing application's licence error were not candidates and did not move. The categories list is the one part of the page the director can check against his own experience, since he raises tickets too.
The Tickets That Never Arrived, With the Counterfactual Stated
The counterfactual is what would have happened without the programme. And every claim of tickets that never arrived is a claim about it, so the claim has to say what it assumes. The honest form is a sentence with four parts: how many fewer tickets a month, in which ticket types, against what baseline, with what control. "About ninety fewer tickets a month in the four types we fixed, against the three-month baseline before each fix, with the untouched types steady" is such a sentence. "Tickets are down a hundred and ten a month" is not, even though it is true. About eighteen of the hundred and ten were in types the programme never touched. The quoted claim lets the reader assume they were all the desk's doing. The method for the four-part sentence, with the baseline rules, the control type and the trap of the quiet month, is in measuring the tickets that never arrived. This article applies it to the programme as a whole rather than re-deriving it.
Carry a low and a high count, the way the ROI series carries them in deflection math without fooling yourself, and never collapse them. Redbrook's low count was about eighty: the tickets that matched the exact symptom of each removed cause, read from the ticket text, and no others. The high count was about ninety-two: the whole drop in the four fixed types after the control's drift was taken off. The truth is between them. The report says "between about eighty and ninety a month". And the director, who has halved flattering figures for years, has nothing to halve. Give a single figure only if one is demanded, give the middle, and say that is what it is.
Remember: never claim the whole queue's drop. Claim the drop in the ticket types you fixed, against a three-month baseline, after the control type's drift is removed. Give it as a range from the exact-symptom count to the whole-type count, and say in the same sentence what the rest of the drop was.
Say what the rest of the drop was, in the same breath, because a reader who finds it out later will wonder what else was left out. At Redbrook the other eighteen a month were seasonal quiet in the works site's autumn and a small fall in how-do-I tickets after a training session the desk had nothing to do with. "The remaining drop is season and a training session run by HR, and we do not claim it" costs one sentence and buys the rest of the page.
Before and After by Type
The before-and-after table is one row per fixed type. Each row has the three-month baseline, the three months after the fix, the control type's movement, and the word. The table is the evidence behind every other number on the page. The method for tracking a type over time, with its trend sheet and its rolling average, is in volume by category over time; the table here is that sheet's summary row for each fixed cause. Redbrook's four removed types and its one reduced type make five rows. The control type, genuine printer faults, ran at about twenty-six a month before and twenty-five after. It sits beneath them as the line that says the desk was not simply quieter.
| Ticket type (the cause fixed) | Baseline, per month | After the fix, per month | Control type over the same months | Word |
|---|---|---|---|---|
| Stale-credential lockouts (old password on phones) | About 54 | About 9 | Printer faults steady, 26 to 25 | Removed |
| Printer driver defaults reset after updates | About 31 | About 6 | Printer faults steady | Removed |
| Disk-full slowdowns, works-site machines | About 16 | About 2 | Printer faults steady | Removed |
| Dock disconnects, one laptop model | About 24 | About 6 | Printer faults steady | Removed |
| Shared-mailbox request, new sales starters | About 14 | About 8 | Printer faults steady | Reduced |
| Scheduled restart stopped after an update | About 12 before the first fix | Back to about 11 in the third quarter; about 2 after the re-fix | Printer faults steady | Returned, then removed |
Draw one chart from this table, if a chart is wanted, and make it the kind that helps. Use one line per fixed type, monthly counts, with a mark on the month each fix went in and a date on the axis. That is the shape charts that help and charts that hide recommends. A line that drops at the mark and stays down is the whole argument in one picture. A pie chart of categories removed is the whole argument in no picture at all. And I have seen one presented, with a legend, in three colours, to a room that nodded.
The Picture: Where the Hours Went
The four numbers come together in one strip, and the picture below draws it for Redbrook across the year. Each quarter is a bar of the desk's roughly 140 working hours a week, split into three bands. Queue work is in orange, prevention in green, and everything else, projects, training and cover, in cream. In the audit quarter the queue took 112 hours and prevention none. In the second quarter prevention took four hours a week and the queue fell to 106 as the lockouts came out. In the third, prevention was six and the queue 100, as the disk sweeps and the printer driver fix landed. In the fourth, prevention was eight and the queue 94. The docks were fixed, and the certificate renewal was done from the calendar as a quiet change rather than as the morning everyone failed. Under each bar is what was removed that quarter, and at the right is the ticket count per month, from about 520 to about 410.
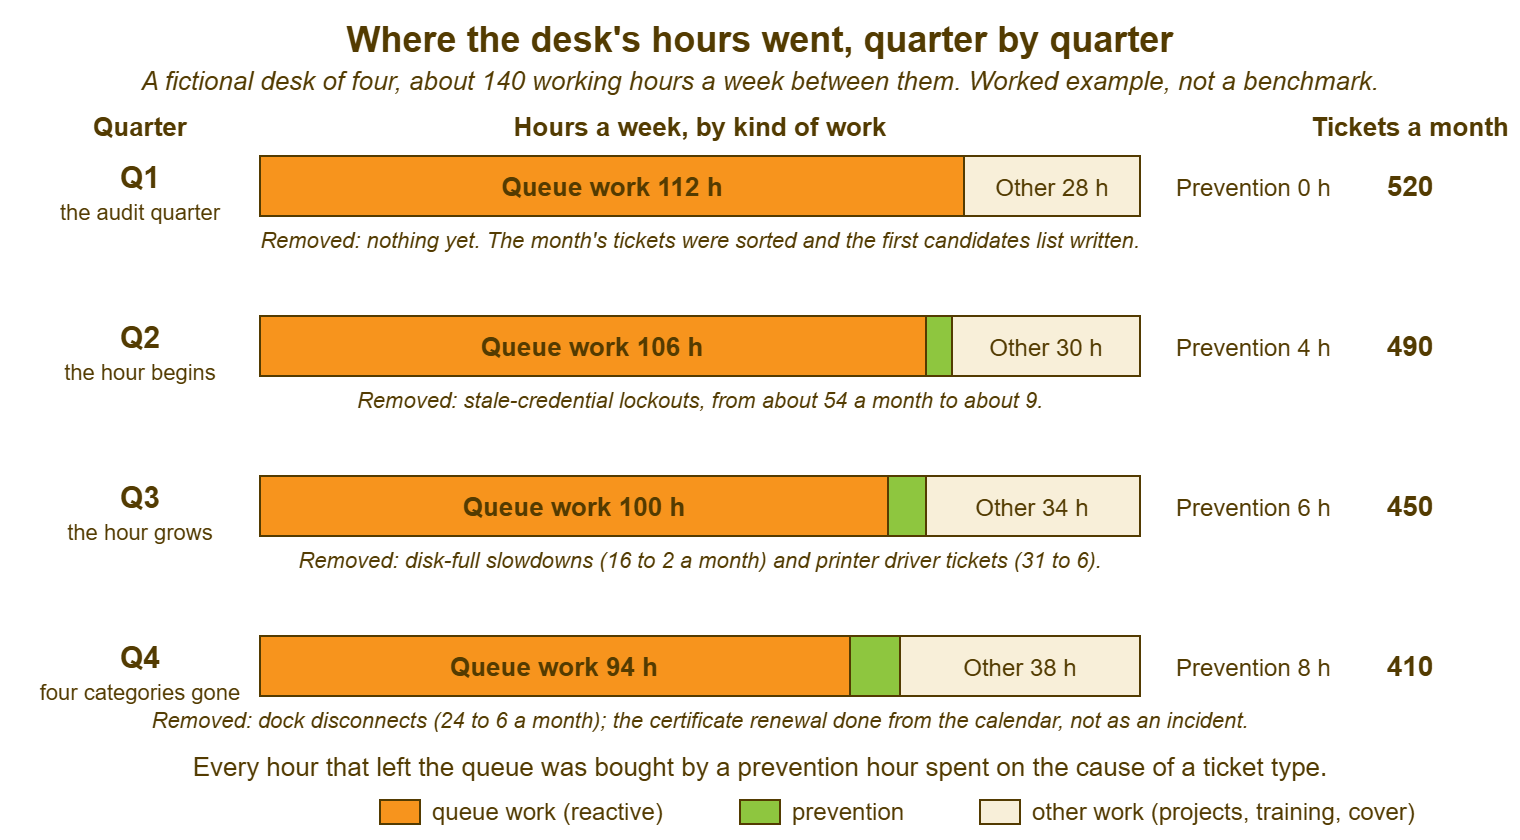
Read the strip for the two things it shows and the one thing it does not. It shows that prevention hours were small, eight a week at most, and that the queue band shrank by eighteen, which is the return on the investment drawn to scale. It shows where the freed hours went: some to a bigger prevention slice, more to the cream band, which is where the works-site switch project finally got finished. What it does not show is the cause of the shrinking, which is why the strip sits under the table rather than instead of it. A strip like this with no before-and-after table behind it is a picture of a desk that got quieter, and desks get quieter for reasons.
From Tickets to Hours, in Two Columns
Turn the tickets that never arrived into hours the same way the ROI series does. Use two figures per ticket type that must never be mixed. One is the hands-on time a technician spends on one such ticket. The other is the loaded figure that adds the desk's overhead, the interruption, the re-reading and the walk-up that came with it. The two figures, and why the loaded one is larger than anyone expects, are in what ROI means for a help desk. Redbrook's removed tickets averaged about half an hour hands-on across the four types. So the low column is roughly eighty to ninety tickets a month at half an hour: about forty to forty-five hours a month. The loaded figure for the desk was close to an hour, so the high column is about eighty to ninety hours a month.
Check the high column against the strip, because the strip is the independent witness. The queue band fell by eighteen hours a week, which is about seventy-eight a month, and that sits inside the two columns, nearer the top. It should: the removed tickets were the interrupting kind, the lockout at 08:40 and the slow machine at month-end. And the hours they took from the queue were never just their hands-on time. Where the strip and the columns disagree badly, one of them is wrong. In that case, it is usually the columns, because the strip was measured from the roster and the columns were estimated from a sample. Report the range, forty to ninety hours a month returned, and put the strip beside it.
Subtract the cost, in both columns, and say the net. Prevention cost Redbrook about thirty-five hours a month in the fourth quarter, eight a week plus the loop. Net, the programme returned somewhere between five and fifty-five hours a month by year end. That is between nothing much and most of a technician's week, and the honest report says exactly that. It adds the sentence that the low end is the one the desk can defend under oath and the high end is the one the strip suggests. A programme reported at its high end alone will be halved. A programme reported as a range will be believed, and belief is what the next year's hour is bought with.
The Line in the Leadership Report
The programme gets one line in the monthly report and one paragraph in the quarterly review. And both are built from the four numbers with no adjective in either. The monthly line, in the format of the monthly report they will read, is: "Prevention: eight hours a week; one cause removed this month (dock disconnects, twenty-four to six); about eighty to ninety fewer tickets a month in the fixed types against baseline, control steady; forty to ninety technician hours a month returned for about thirty-five spent." The quarterly paragraph, in the shape of the quarterly review, adds the before-and-after table, the strip, and the one that returned and was re-fixed. It adds the sentence about what the rest of the volume drop was. That is the whole report. It takes Imogen about twenty minutes to produce from the loop sheets, and it has taken the director progressively less time to read.
Say what is not claimed, in the report, every time. Not the whole volume drop. Not satisfaction, unless the survey asked about the fixed types and the answers moved, which is a different measurement in its own series. Not a business outcome the desk cannot evidence: "the works site shipped on time because of us" is a sentence the works site gets to say, not the desk. What the desk can say is that about eighty to ninety people a month did not have to stop work and ask for help. The arithmetic for what their waiting would have cost is in the economics series and is theirs to apply. The desk reports its own numbers and lets the rest of the organisation draw the conclusions.
What the Numbers Must Never Do
The numbers must never rank technicians. A per-person count of causes removed is a measure of which technician was given the cheap candidates. Reading it as performance punishes whoever owned the hard one. The rule that per-technician figures are for coaching, read only above a minimum sample and never shown outside the team, is the one in dashboards that motivate instead of surveil. And it applies here with extra force because the sample is three or four causes a year. If you run QuerySolv, the standard reports on volume, backlog by age and resolution times are the before-and-after source for the whole desk. In that setup, the per-technician reports stay inside the team for coaching. In any tool, the same split should be made on purpose.
The numbers must never only improve. A scorecard on which every quarter is better than the last is a scorecard someone has started managing. And the return in the third quarter at Redbrook, written down with its re-fix, is the line that proves the others were not. Expect a quarter in which a category returns, or the prevention hours are lost to an incident, or the low count falls below the cost, and report it as it happened. The credibility a bad quarter handled honestly earns is the subject of when the numbers are bad. Prevention has more bad quarters than most programmes, because it is measuring things that did not happen.
And the numbers must never mistake a shadow channel for a success. If a ticket type fell because the users stopped raising tickets and started phoning Kwame, the tickets did not disappear; they moved somewhere the desk cannot count. The check is the one from the seven quiet failures. Look for a department whose volume fell faster than its headcount predicts. Look for a technician whose inbox is busier than the queue, and tickets that begin "as discussed". A category that fell with no fix behind it is not a prevention result. It is a question, and the counterfactual sentence is where it gets asked.
A Short War Story: The Summer Drop at Dunmore College
Dunmore College's desk of three, led by Ewan, started a prevention hour in the spring. They removed two genuine causes by June. They reported to the bursar in August that ticket volume was down by nearly two fifths since the programme began, which was true. The two causes accounted for perhaps forty tickets a month of the drop. The other hundred and sixty were the summer, when most of the college's eleven hundred students and a third of its staff were not there. The report did not say so, because nobody had asked and the chart looked wonderful. In October the volume came back with the students. The bursar asked why prevention had stopped working. Ewan spent a difficult meeting explaining seasonality to someone who had believed the August chart because it had been presented without a caveat. The two causes were still removed. Their forty tickets a month were still gone. None of that was believed for the rest of the year, because the one number that had been overclaimed had taken the honest ones down with it. The hour survived, narrowly, on condition that every future figure came with a baseline and a control. A drop that is not checked against what else changed in the same months is not prevention. It is the calendar, with the desk's name on it.
The Proactive Scorecard
The scorecard below is one page a quarter, built from the monthly loop sheets. And it is the page the quarterly paragraph is written from. Section A is the share of hours, taken against scheduled, with lost hours and their reasons. Section B is the categories by name, with the before, the after, the control and the word. Section C is the counterfactual sentence, written out in full with its four parts, and the low and high counts. Section D is the hours, in two columns, with the cost subtracted and the strip's queue-band change beside them as the witness. Section E is what is not claimed, which is the section most scorecards leave out and the one that makes the others believable. Section F is the checklist the page does not leave the desk without.
THE PROACTIVE SCORECARD — ONE PAGE, ONE QUARTER
Desk: ______________________   Quarter: ____________   Prepared by: ______________   From loop sheets: ____ / ____ / ____

A. HOURS IN PREVENTION
   Desk working hours a week (all technicians) ............ ______
   Prevention hours a week, scheduled ..................... ______    taken ______    lost ______
   Lost-hour reasons (count each): incident ____  cover ____  highest priority ____  other ____
   Loop hours this quarter ................................ ______

B. CATEGORIES, BY NAME
   Cause fixed                              Fixed on    Before/mo   After/mo   Control before/after   Word
   _______________________________________  ________    ______      ______     ______ / ______        removed / reduced / returned
   _______________________________________  ________    ______      ______     ______ / ______        removed / reduced / returned
   _______________________________________  ________    ______      ______     ______ / ______        removed / reduced / returned
   _______________________________________  ________    ______      ______     ______ / ______        removed / reduced / returned
   Types NOT touched by the programme this quarter (named, so nobody assumes): ________________________________

C. THE TICKETS THAT NEVER ARRIVED (the counterfactual, in four parts)
   "About ______ to ______ fewer tickets a month, in the types listed in B, against a three-month
    baseline before each fix, with ______________ as the control type, which moved from ______ to ______."
   LOW count (exact-symptom tickets only, from the ticket text) ...... ______
   HIGH count (whole drop in the fixed types, after control drift) .... ______
   The rest of the quarter's volume change, and what it was ........... ______  because: ______________________

D. HOURS RETURNED                                              LOW          HIGH
   Tickets avoided per month (C low / C high) .................. ______       ______
   Hours per ticket (hands-on / loaded) ........................ ______       ______
   Gross hours returned per month .............................. ______       ______
   Prevention cost per month (A, taken, plus loop) ............. ______       ______
   Net hours per month ......................................... ______       ______
   Witness: queue-band change on the roster, hours a week ...... ______  (should sit inside the two columns)

E. NOT CLAIMED THIS QUARTER
   [ ] The whole volume drop        [ ] Satisfaction, unless the survey moved on the fixed types
   [ ] Any business outcome the desk cannot evidence      [ ] Any per-technician figure outside the team

F. BEFORE THIS LEAVES THE DESK
   [ ] Every category in B has a control and two readings
   [ ] C is written as the full sentence, not a number
   [ ] Both columns in D are present; the range is what is reported
   [ ] The rest of the drop is explained in C, even if the explanation is "season"
   [ ] At least one line in B says reduced or returned, or the quarter is explained
   [ ] The monthly report line and the quarterly paragraph are copied from this page, not written fresh
Imogen's scorecard for the fourth quarter had four removed, one reduced and one returned-then-removed in section B. It had the four-part sentence in C with eighty and ninety-two in it. It had "season, and a training session HR ran" on the line for the rest. The director read it on Monday, asked what the control type was, and renewed the hour for the year. He did not divide anything by two. There was nothing on the page he needed to.
Frequently Asked Questions
Which of the four numbers should we report first?
We have no control type that stayed steady. What do we do?
How soon after starting can we show anything?
Should the scorecard include the maintenance calendar's results?
The low column is below the cost this quarter. Do we report that?
Can we show per-technician prevention results in a team meeting?
From the QuerySolv team: we build self-hosted help desk software for Windows. QuerySolv runs as one Windows service on your own network. It takes requests by web form, e-mail, live chat, social messages and REST API. It is licensed once per installation rather than per agent per month. The free trial runs the full product for 30 days.