
Measuring Help Desk Load Without Surveillance
Tuesday, 11:30, at Pennant Freight. Hannah runs the desk of four. The finance director has just asked her, in a corridor, for "utilisation per agent, so we can see who's pulling their weight" before the budget meeting on Thursday. She has the data. The ticket system holds every close, every reply and every timestamp for the last three years. She could produce a table by lunchtime that would make one of her technicians look lazy and another look heroic. Both readings would be wrong. She also knows the question behind the question, which is whether the desk really needs the fifth person she asked for in the spring. The same numbers will answer either question. What they will not do is tell the finance director which one he asked.
Measuring load means reading the desk's own data for how much work is being carried, by how many people, and whether that can continue. That way, the desk can make staffing, rota and scope decisions. Surveillance means reading the same data to watch, rank or judge the individuals doing the carrying. The numbers are identical. The difference is the question being asked and who gets to see the answer. A desk that does not decide that difference in advance will drift into the second use while believing it is doing the first. This article is the last in our Helpdesk Burnout series. It exists because every earlier article said "measure the load" and this is where the measuring has to be done without making anything worse.
It covers why the same numbers can serve two different questions. It covers the four signals in turn: tickets per technician read as capacity, after-hours activity, leave not taken and the reopen rate. Next come reading the four together and as a team, then what the desk never does with the numbers. We cover the honest line in the leadership report, then the monthly routine. We finish with a short war story and the load signals sheet to copy, in that order.
The Same Numbers, Two Different Questions
A count of tickets closed per technician this month is a fact, and the fact is neutral until a question is put to it. "Is this desk carrying more than four people can sustain?" is a capacity question, and the count helps answer it. "Who is the weakest technician?" is a performance question, and the count answers it badly, because it rewards whoever took the easy tickets. The number has not changed. The desk has changed what it is for. In doing so it has changed what the technicians will do about the number from next week. People are quick to learn what a number is for.
There is a simple test for which side of the line a reading sits on. Would the manager be comfortable if the technician were sitting beside them watching them read it? A manager looking at the desk's total after-hours activity to see whether the team is finishing at home can say so to anyone. A manager looking at one person's evening timestamps to check whether they really stayed late is doing something else, and knows it. If the reading would be a surprise to the person being read, it is surveillance, whatever the dashboard calls it.
The second test is who sees the result. Load figures are read as a team, by the team, with the manager, and the team view is the one that is kept. Per-person figures exist, because the data is per person, but they are read in one place only. That is a private coaching conversation between the manager and that person about their own work. This is the rule the Group VI metrics articles in this library set and the one Dashboards That Motivate Instead of Surveil explains at length. Nothing in this article rebuilds that argument. It assumes it, and builds the load reading on top of it.
Signal One: Tickets per Technician, Read as Capacity
The first signal is how many tickets each person is carrying. And the question put to it is "how is the work spread, and is anybody carrying more than one person should?" rather than "who did most?" Read two figures. The first is tickets touched per person in a week, which is the interruption load made countable. The second is tickets open per person right now, which is the weight they are holding. The desk figure is the sum; the capacity reading is the shape. Four people carrying forty tickets each is a desk under load. One person carrying ninety and three carrying twenty is a desk with a load problem that is also a rota problem. And the ninety is the person the first article in this series called always available.
The spread is the thing to look at, not the top of the list. A desk where one name holds twice the open tickets of anyone else, month after month, has organised itself around that person's willingness. The reading is not "they are good" or "the others are slow" but "the load is not being shared, and here is by how much". That is a rota finding, and the rotation in Sustainable Pacing is the fix. Ownership may work by claim, so that every ticket in progress shows the name of the person who took it, as it does in QuerySolv. In that case, the spread is visible on the queue itself, to everyone, all the time, without anybody watching anybody. That is the healthy version of the number: the team can see its own shape.
Read it as a trend as well as a snapshot. A desk whose tickets-per-person figure has risen by a third over a year with the same four people has absorbed a third more work without anyone deciding it should. That single line, with the volume report behind it, is most of a staffing case. The method for reading volume honestly, and the traps in counting tickets at all, are in Ticket Volume Analysis; use its rules. The per-person cut adds only one question to them: is the rise falling on everyone, or on one person?
Signal Two: After-Hours Activity
After-hours activity is any event on a ticket with a timestamp outside the desk's agreed hours: a reply, a note, a status change, a close. It is counted for the whole desk by week. It is the most honest of the four signals because nobody records it on purpose. The ticket system writes the time whether or not the technician wanted anyone to know they were working at ten at night. A desk with no after-hours cover arrangement that shows thirty such events a week has people finishing the day at home. And those people are the ones who will show the signs first.
Count it for the desk, watch the trend, and resist the per-person cut except in a coaching conversation. The reading is "the desk is doing a day and a half a week of work outside its hours", not "Marcus replied at 22:40 on Tuesday". If the desk has a formal on-call or after-hours arrangement, those events are expected and belong to a different measure, the one in Measuring and Reducing After-Hours Load. In that case, take those events out before reading this signal, or the on-call person will look like the problem. What this signal is after is the quiet overtime nobody arranged.
Then act on the desk figure, in the open. "We did about forty ticket events outside hours last week, which is a day of work the roster does not show; I want it at nearly nothing, and if the day's work does not fit in the day, that is a staffing conversation I will have, not a reason for anyone to finish it at home." Said to the team, that sentence turns a number that could have been a reprimand into a protection. The team will tell you what the forty events were. It is usually the same two people, and it is usually because the queue-duty block ran over, and both of those are rota fixes.
Signal Three: Leave Not Taken
Leave not taken is the balance of holiday each person is entitled to and has not booked. It is read as a desk total and as a count of people who have booked none in the last quarter. It is a load signal because leave is recovery, and recovery not taken is load not put down. A desk where everyone is carrying over most of a year's leave is a desk where nobody believes they can be away. And that belief is a fact about the staffing, not about the people. Entitlements and carry-over rules vary by place and by contract; check both before saying anything about what anyone is owed. The signal does not need the rules. It needs the count.
The reading is twofold. As a desk, is the balance going up over the year, which says the desk is not making room for anyone to be away? And as a shape, is one person carrying the most leave while also carrying the most tickets, which is the always-available person again, seen from a third angle? Where that person exists, the fix is not to tell them to take leave, which they have heard before. The fix is to book it with them and put the cover on the roster. "Take some leave when it's quieter" is an instruction with no date on it and is never carried out.
This is the one signal the ticket system does not hold. And it comes from wherever the organisation records leave, which the manager can usually see for their own team. Do not ask the technicians to report it themselves. A person who has not taken leave for a year already knows, and being asked to confirm it in writing is one more thing. The manager looks, once a month, and acts on what they see.
Signal Four: The Reopen Rate Climbing
The reopen rate is the share of tickets marked resolved that the requester came back to say were not. As a quality measure it belongs to Measuring Reopens Honestly, which defines it properly and this article does not. As a load signal it means something specific. A desk-level reopen rate that climbs while the close rate holds is a desk closing tickets faster than it is fixing them. People close faster than they fix for one reason, which is that they are trying to keep up. It is the tired technician's "done" from the first article in this series, counted.
Read it for the desk, by month, as a trend. Most tools that report on volume and backlog also report the reopen rate as a standard figure. The figure that matters here is not its level but its direction over the last quarter, and whether that direction matches the other three signals. A reopen rate that climbs in the same quarter as tickets-per-person rose, after-hours events doubled and nobody took leave is not four separate findings. It is one finding, seen four ways, and that is the point of the next section.
Resist reading it by person except in the coaching conversation, and never from a small sample. A reopen rate on a dozen tickets is noise. The minimum before a per-person figure means anything is argued in Satisfaction by Category and Carefully by Agent, and the same floor applies here. The desk figure, over hundreds of tickets, is the one worth watching, and it is the one that answers the load question.
Reading the Four Together
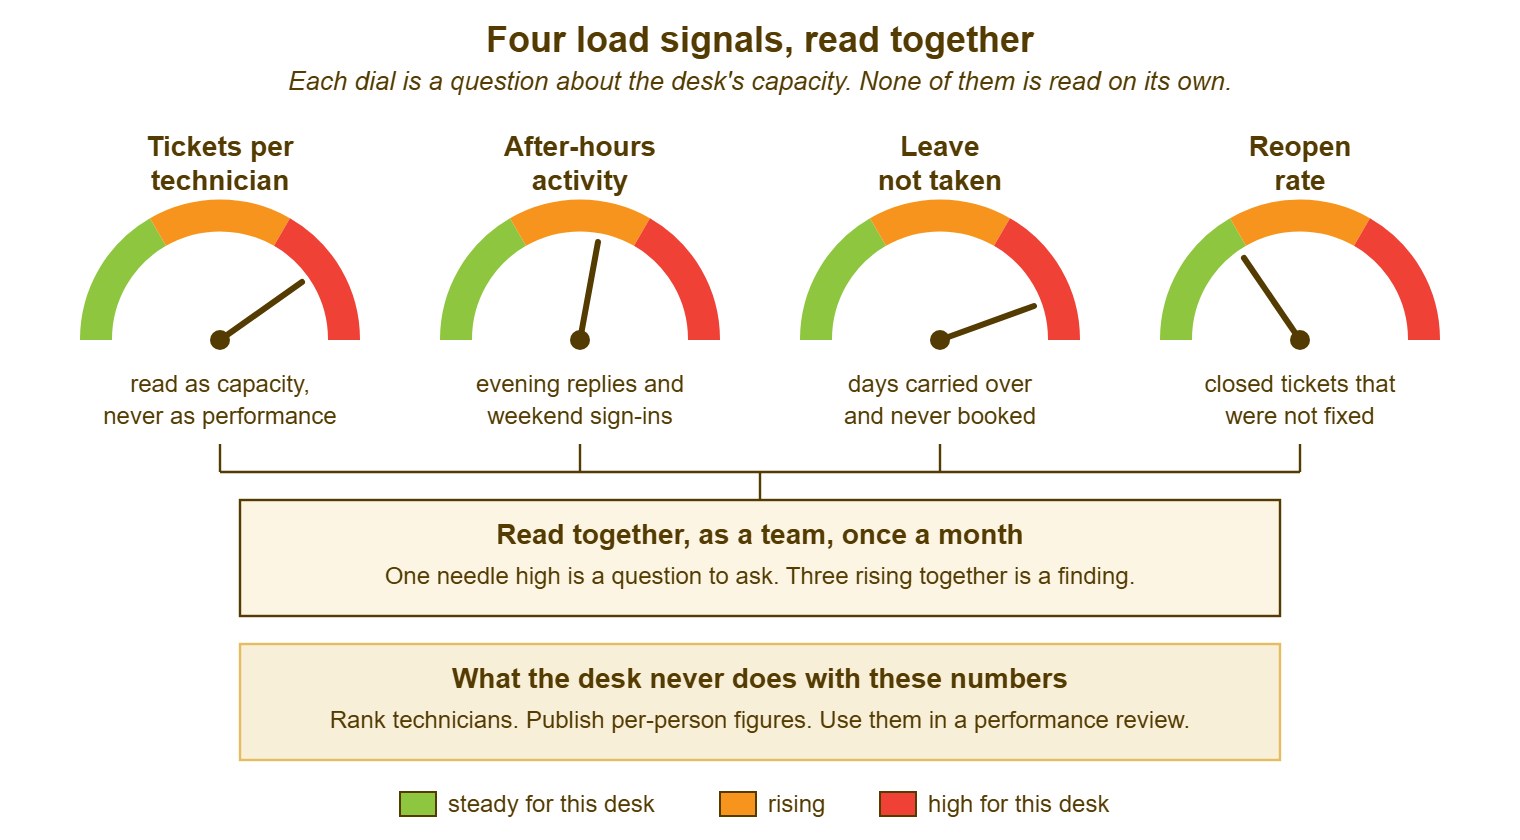
None of the four signals is read on its own, because each has an innocent explanation and an alarming one, and only the other three can tell you which. The picture below draws them as four dials with a bracket joining them. They show tickets per technician high, after-hours activity rising, leave not taken high, and the reopen rate on the edge of rising. One dial high is a question to ask. Three rising together is a finding. The finding is that the desk is carrying more than its people can sustain. It has started to pay for it with their evenings, their holidays and the quality of their fixes, in that order. The box at the bottom of the picture is the rule from the previous section and the next one. The dials are read together, as a team, once a month, and nothing on them is used to rank anybody.
The combinations are what make the reading useful, and the table gives the ones that come up most often. Tickets per person rising with nothing else moving is probably volume growth the desk is absorbing for now, and the question is for how long. After-hours activity rising on its own is often one person and one habit, and a quiet word about the roster usually finds it. Leave not taken alone may be a team that likes its summer holiday late. But tickets rising with after-hours rising is a day that no longer fits in the day. All four together is a desk that has been running past its edge for a quarter and has started to show it in the only places the ticket data can see.
| What the dials show | The likely reading | The first question to ask |
|---|---|---|
| Tickets per person rising; the other three steady | Volume growth the desk is absorbing, for now | How long has it risen, and is the rise shared or on one person? |
| After-hours rising on its own | Usually one or two people and a block that runs over | Which blocks run over, and why does the day not end on time? |
| Leave not taken rising on its own | Nobody believes they can be away | What would have to be true on the roster for each person to book a fortnight? |
| Reopen rate rising on its own | A fix that has stopped working, or a quality slip | Which ticket types reopened, before asking who closed them? |
| Tickets and after-hours rising together | The day's work no longer fits in the day | What is the gap in hours, and what is the staffing or scope answer? |
| Three or four rising together over a quarter | The desk is past its edge and paying with evenings, leave and quality | What does the leadership report say this month, and who is being told? |
Read the dials as a team, with the team, so that the people the numbers describe are in the room when they are read. This is the single habit that keeps measurement from sliding into surveillance. A number read in front of its subjects is a shared fact and a number read about them in private is a file. The team will also read it better than the manager alone. The technicians know why Thursday's after-hours events happened, and the manager, in most cases, does not.
What the Desk Never Does With the Numbers
The desk writes down, once, what it will never do with the load signals, and the list is short enough to pin up. It never ranks technicians by any of them. It never publishes a per-person figure, on a wall, in a report or in a meeting. It never uses one in a performance review, because a number that can end up in a review is a number everyone will manage. The manager will then be measuring the managing. The desk never sets a per-person target on any of them, for the same reason. And it never reads a per-person figure from fewer tickets than the minimum the desk agreed, because a small sample is a story the reader was already telling themselves, with a decimal point added.
Two more belong on the list and are less obvious. The desk never measures something the technicians do not know is measured. The four signals, how they are computed and what they are for are told to the team before the first reading. Anybody can ask to see the desk view at any time. And the desk never answers a performance question with a load measure, however the question is phrased from above. "Who is pulling their weight" is answered with "the desk is carrying this much with four people and here is how it is spread". The per-person question is declined, politely, with the reason. It is the hardest sentence in this article to say to a finance director, and the one that most protects the desk.
Remember: the load signals are read together, as a team, once a month, and never used to rank, publish, target or review any individual. If a reading would surprise the person being read, it is surveillance, whatever it is called.
The Honest Line in the Leadership Report
The load belongs in the monthly report as one or two lines, in the desk's own figures, with no names. "The desk handled about eight hundred and forty tickets this month with four people; tickets per person have risen by about a third over the year; the desk did roughly a day a week of work outside its hours; three of four people have taken no leave this quarter; the reopen rate has risen for three months. Read together, these say the desk is past the capacity of four, and the staffing case from the spring stands." That is the whole paragraph, and it is the most useful thing a desk manager can put in front of leadership. It turns "the team is stretched" into something a director can act on or decline on the record.
The shape of a report leadership will actually read, and which numbers belong in it and which stay on the desk, is in The Monthly Report They Will Read. And the load line follows its rules: plain words, the desk's figures stated as the desk's figures, no industry comparisons, and a sentence saying what the desk wants done. When the numbers are bad, which is when the load line matters most, When the Numbers Are Bad is the article on how to say so without either hiding it or dramatising it.
The finance director's request gets its answer in the same report. Hannah's reply, sent that afternoon, said that she would bring the desk's capacity figures to Thursday. She said per-person figures were reviewed in coaching and not published because they rewarded easy tickets and punished hard ones. She added that if the question was whether the desk needed the fifth person, the four signals were the answer and she would walk through them. He accepted it. Directors mostly do, when the alternative is offered in the same sentence as the refusal.
The Monthly Routine
The reading takes twenty minutes once a month, in the team meeting, from the sheet at the end of this article. The manager fills in the four desk figures beforehand, from the volume report, the event timestamps, the leave record and the reopen report. The manager brings last month's sheet so the direction is visible. The team reads the four together, agrees the reading in a sentence, and agrees one action, which is usually a roster change, a scope conversation or a line in the leadership report. The sheet is kept where the team can see it. The per-person cuts, where the manager has looked at them, stay in the manager's file for the one-to-ones described in The Manager's Responsibilities, and nowhere else.
Expect the first reading to be uncomfortable, because the first reading is usually the one that shows a year of drift nobody had put numbers to. Expect the second and third to be the useful ones, because they show direction, and direction is what the leadership line needs. And expect, after six months, that the team will start asking for the reading. A group of people who can see their own load as a fact rather than a feeling tend to want to keep seeing it. That is the opposite of surveillance, and it is the point.
A Short War Story: The Utilisation Report at Greyfell Timber
At Greyfell Timber the desk of three was asked for utilisation figures by a new operations manager. The desk lead, Saoirse, produced a monthly table of tickets closed and time logged per technician, sorted. It went into the management pack and onto a screen by the kitchen. Within two months the time logged per ticket had risen across the desk, because the technicians had learned that logged time was being read as effort. The close count had risen too, because small tickets were being split and closed in pieces. The reopen rate, which nobody was reading, roughly doubled. The signal nobody looked at was after-hours activity. It showed one technician, Ruairi, finishing most of his real work between seven and nine in the evening to keep his daytime close count respectable. Ruairi left after a term of it with a two-line resignation that mentioned the screen. The cost was a technician and a quarter of recruitment. There was also a management pack whose desk figures had been fiction for half a year and had to be withdrawn. The operations manager took that worse than the resignation. Saoirse's note in the review was that the desk had measured exactly what it had been asked to measure, and that the asking had been the mistake.
The Load Signals Sheet
The sheet is one page a month, filled in by the manager beforehand and read by the team together. Section A is the four desk figures with last month's beside each and an arrow for direction. B is the reading, agreed as a sentence. C is the one action. D is the line for the leadership report. E is the list of what the desk never does with the numbers, printed on every copy so that the rule travels with the data. The per-person line in A is deliberately a shape, not a list. It shows how many people are carrying well above the desk's average, and whether it is the same people as last month. Names do not go on the sheet.
LOAD SIGNALS SHEET — ONE DESK, ONE MONTH
Desk: ______________________   Month: ____________   Read together on: ________   People on the desk: ____

A. THE FOUR SIGNALS (desk figures; last month beside each; arrow for direction)
   1. Tickets per technician (capacity)
      Tickets touched per person per week, desk average: ____   Last month: ____   Direction: ↑ → ↓
      Open tickets per person right now, desk average: ____    Last month: ____   Direction: ↑ → ↓
      Spread: people carrying well above the average: ____   Same people as last month?  Y / N
   2. After-hours activity (outside agreed hours, on-call events removed)
      Ticket events outside hours this month, desk total: ____   Last month: ____   Direction: ↑ → ↓
      Roughly how many working days of work that is: ____
   3. Leave not taken
      People who booked no leave this quarter: ____ of ____   Last quarter: ____
      Desk leave balance carried, direction over the year: ↑ → ↓
   4. Reopen rate (desk level, per the desk's counting rules)
      This month: ____ of ____ resolved tickets   Last month: ____ of ____   Direction over the quarter: ↑ → ↓

B. THE READING (one sentence, agreed by the team)
   Signals rising together: ____ of 4
   What we think it means: _____________________________________________________

C. THE ONE ACTION THIS MONTH
   [ ] Roster change: ______________________
   [ ] Scope conversation: ______________________
   [ ] Line in the leadership report (see D)
   [ ] Nothing; keep reading
   Owner: ________   Done by: ________

D. THE LINE FOR THE LEADERSHIP REPORT (desk figures only, no names)
   "The desk handled ____ tickets this month with ____ people. ____________________________
    ____________________________. Read together, these say ____________________________."

E. WHAT THIS DESK NEVER DOES WITH THESE NUMBERS
   Rank technicians by any of them. Publish a per-person figure anywhere. Use one in a
   performance review. Set a per-person target. Read a per-person figure from fewer than
   ____ tickets. Measure anything the team has not been told about.
   Per-person figures are read only in a private coaching conversation, by the manager,
   with the person, about their own work.
Hannah's first sheet, read with the team on the Wednesday, showed three of the four dials rising together over the quarter. The team's sentence was "we have been carrying five people's work since the spring and paying for it in the evenings". She took the sheet to the budget meeting on Thursday, with the desk's figures and nobody's name. And the fifth person was approved for the next quarter. The finance director never saw who was pulling their weight. He saw how much weight there was, which was the question he had been asking all along, and had not known how to.
Frequently Asked Questions
Is it ever acceptable to look at one person's figures?
Our tool does not report after-hours activity. How do we count it?
Management insists on a per-agent utilisation figure. What do I do?
How many tickets before a per-person figure means anything?
Does leave not taken really belong with ticket data?
What if the four signals say the desk is fine and the team says it is not?
From the QuerySolv team: we build self-hosted help desk software for Windows. QuerySolv runs as one Windows service on your own network. It takes requests by web form, e-mail, live chat, social messages and REST API. It is licensed once per installation rather than per agent per month. The free trial runs the full product for 30 days.